OpenTelemetry
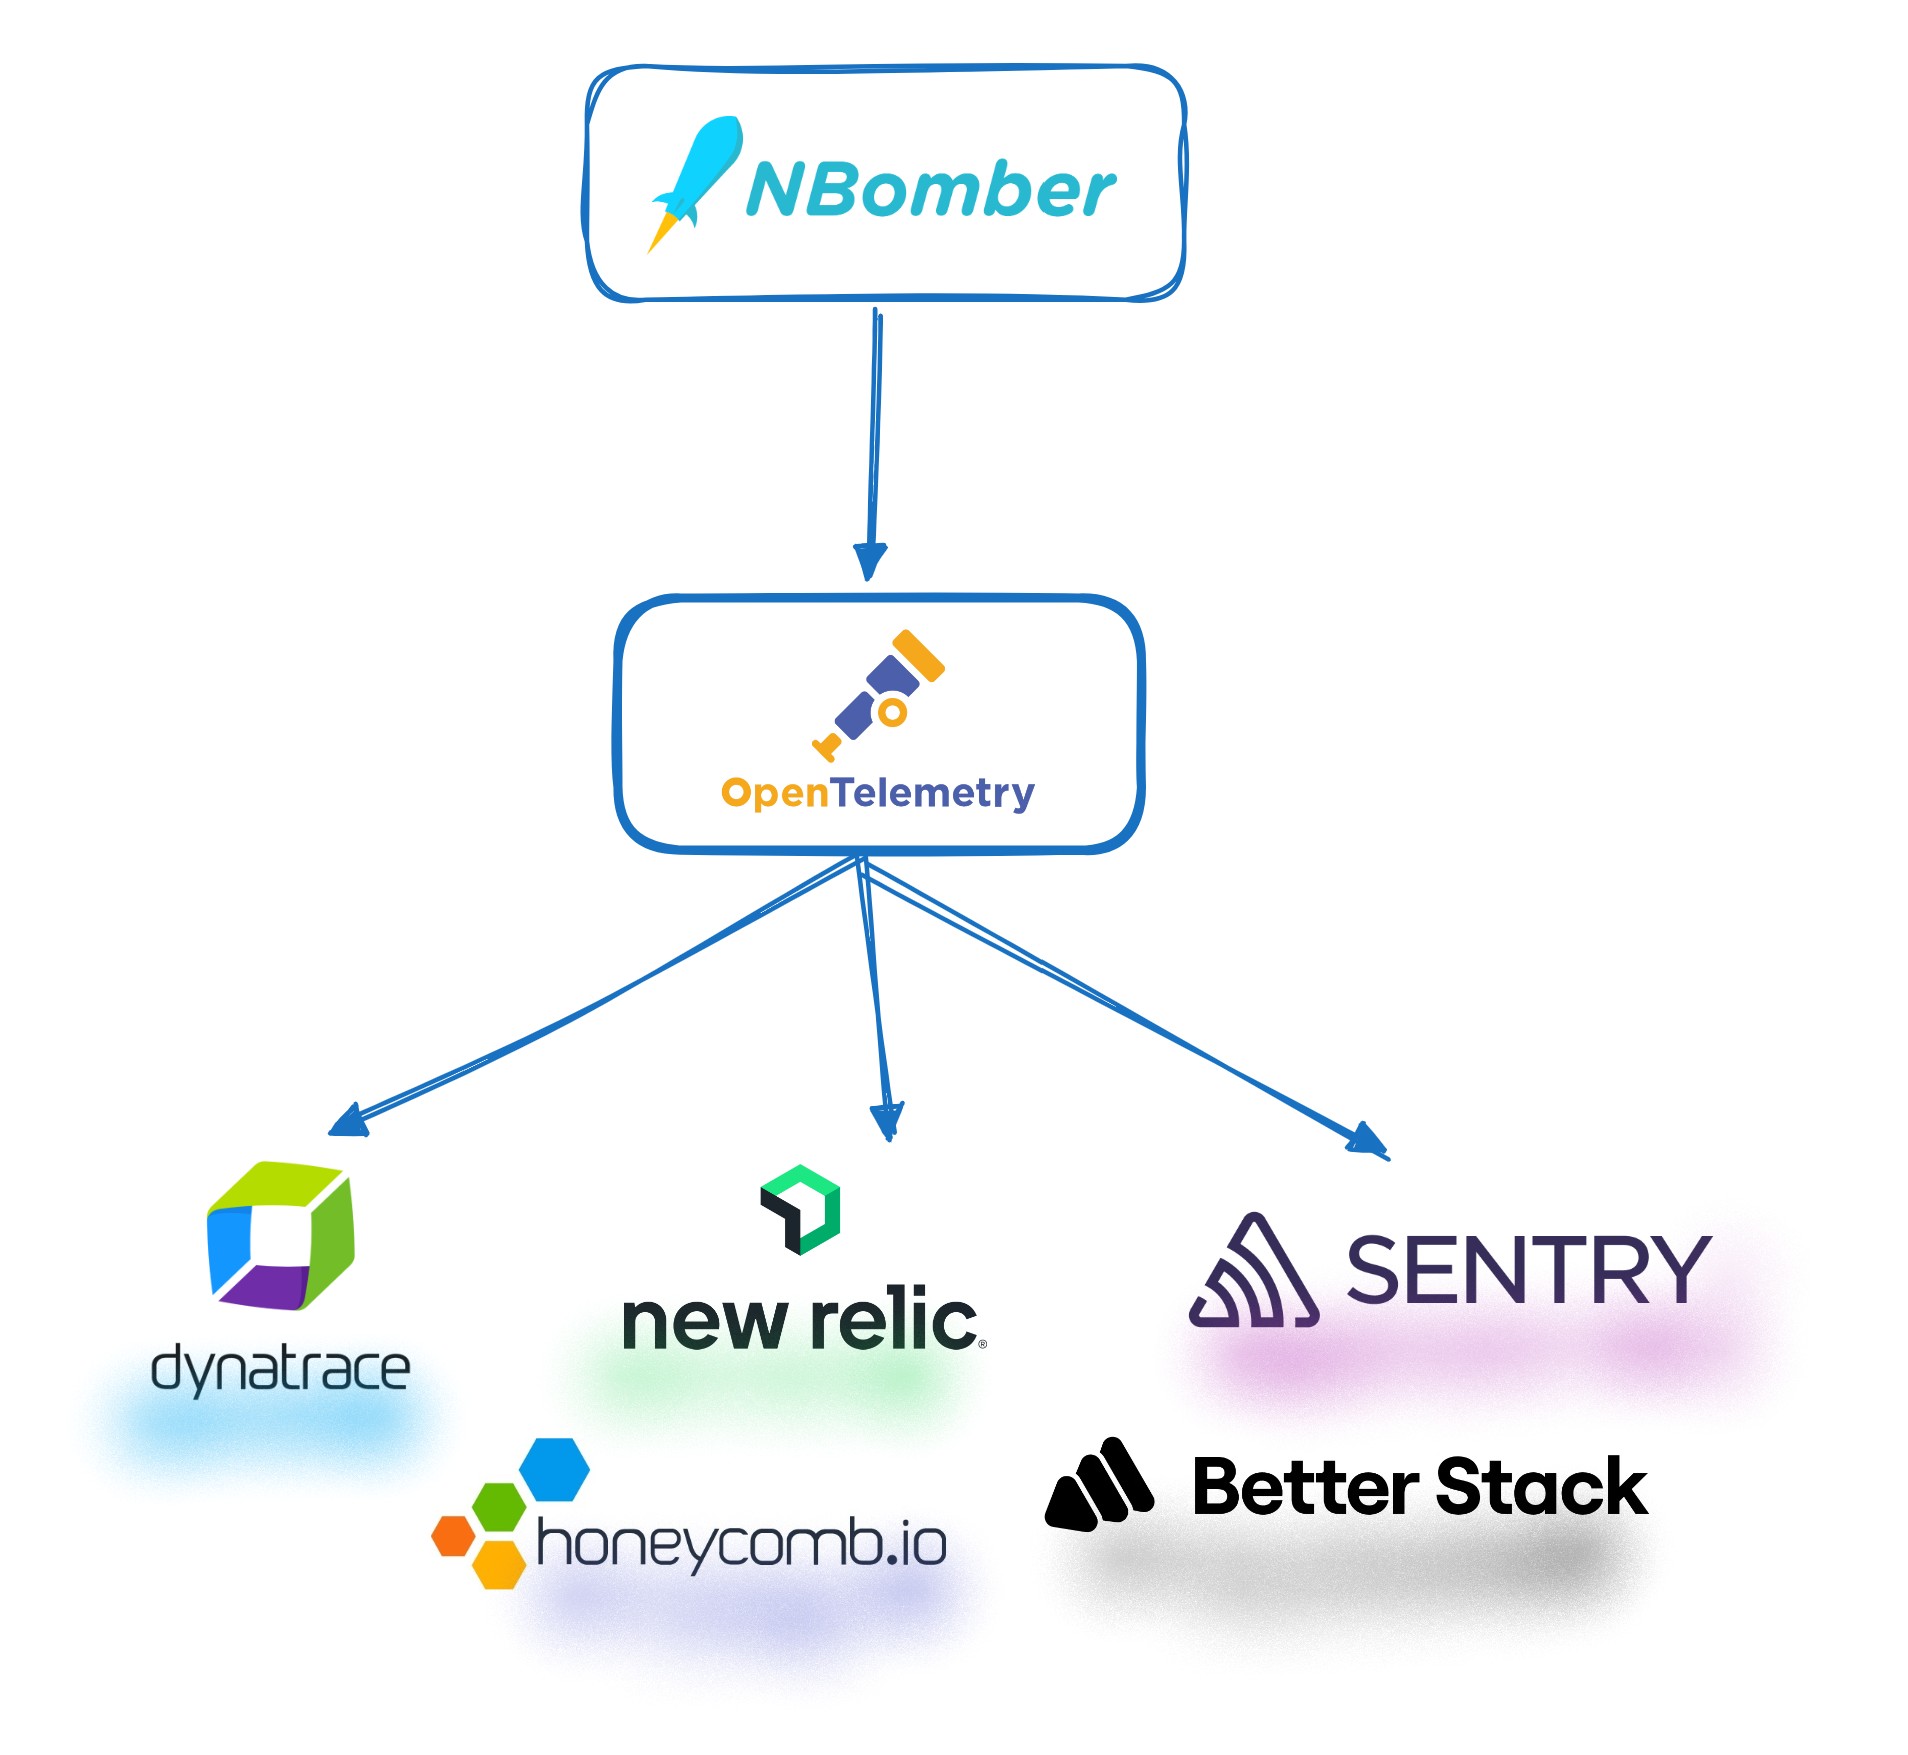
OpenTelemetry is an open-source observability framework that provides standardized APIs, SDKs, and tools for instrumenting, generating, collecting, and exporting telemetry data — including metrics, logs, and traces. It helps developers and operators gain unified visibility into distributed systems by allowing telemetry to be exported to different backends such as Prometheus, Grafana, or Jaeger.
Using Reporting Sinks, you can store NBomber metrics through OpenTelemetry and visualize them in your preferred observability platform. This integration enables real-time insights into your load test performance and system behavior.
This package is experimental and might be subject to breaking API changes in the future. While we intend to keep experimental packages as stable as possible, we may need to introduce breaking changes.
You can find the source code here.
To start working with the NBomber.Sinks.OpenTelemetry package, install it via NuGet:
![]()

dotnet add package NBomber.Sinks.OpenTelemetry
Integrating with OpenTelemetry
OpenTelemetry provides a unified way to send telemetry data to multiple backends using the OTLP (OpenTelemetry Protocol). There are two common options it can be integrated:
- Send metrics directly to an OpenTelemetry-compatible endpoint.
- Send metrics to a local or remote OpenTelemetry Collector. The Collector then forwards the telemetry to your observability backend.
In both approaches, from the NBomber perspective, we simply need to configure the OTLP endpoint to which the NBomber sink will send metrics.
Export metrics directly to an OpenTelemetry-compatible endpoint
This is probably the simplest integration approach. In this approach, NBomber sends metrics directly to the observability platform using the OpenTelemetry Protocol (OTLP).
How it works:
- The sink is configured with the URL of a remote OTLP endpoint (HTTP or gRPC).
- Metrics are serialized in OTLP format and transmitted over the network.
- The observability backend receives and processes the data without requiring intermediate components.
Pros:
- Simplified architecture—no additional infrastructure required.
- Lower operational overhead.
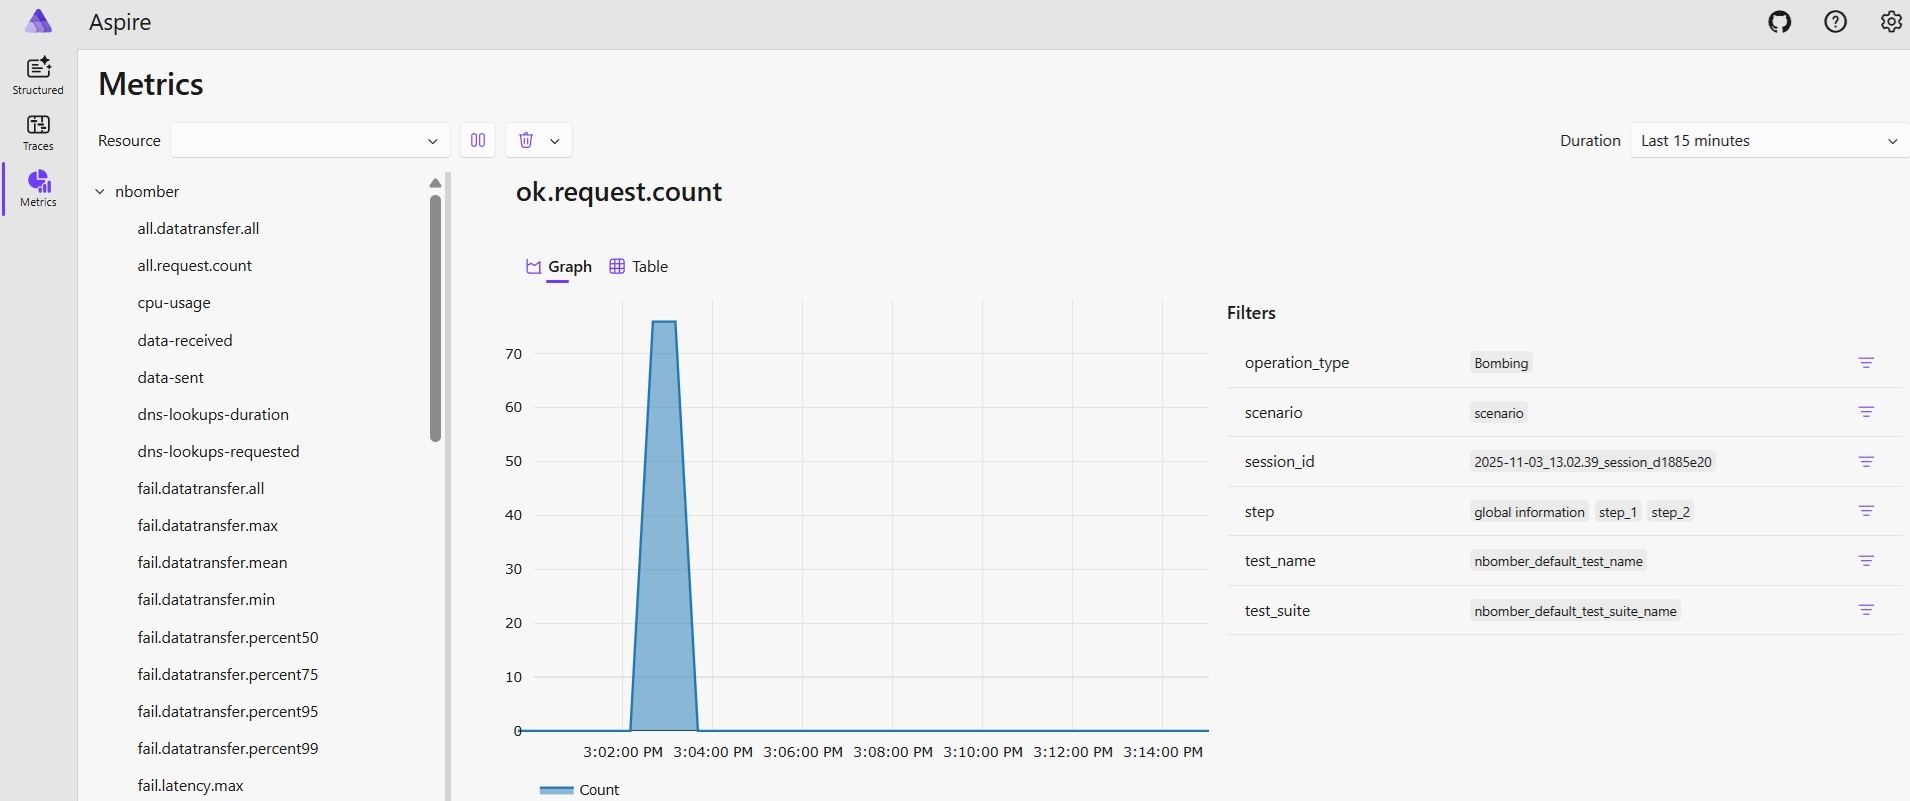
Example: In this example, we will run the aspire-dashboard Docker image, which will act as an OTLP endpoint as well as a metrics dashboard.
services:
aspire-dashboard:
    image: mcr.microsoft.com/dotnet/aspire-dashboard:latest
    ports:
        - "18888:18888"
        - "18889:18889"
To spin up aspire-dashboard locally, run the CLI command in the folder containing the docker-compose.yaml file.
docker compose up -d
The container exposes two ports:
- Port
18889to receives OpenTelemetry data from apps. Apps (NBomber test) send data using OpenTelemetry Protocol (OTLP). - Port
18888has the dashboard UI. Navigate to http://localhost:18888 in the browser to view the dashboard.
After this you should login to the Aspire dashboard.
Now you are ready to run the NBomber test and view the real-time metrics in the Aspire dashboard.
var stats = NBomberRunner
    .RegisterScenarios(scenario)
    .WithReportingSinks(
        new OpenTelemetrySink(new OtlpExporterOptions
        {
            Endpoint = new Uri("http://localhost:18889"),
            Protocol = OtlpExportProtocol.Grpc
        })
    )
    .Run();
Also, you can configure OpenTelemetrySink via JSON Config.
{
    "OpenTelemetrySink": {
        "Endpoint": "http://localhost:18889",
        "Protocol": "Grpc" // Grpc, HttpProtobuf
    }
}
Now you should load "infra-config.json" file.
var stats = NBomberRunner
    .RegisterScenarios(scenario)
    .LoadInfraConfig("./infra-config.json")
    .WithReportingSinks(new OpenTelemetrySink())
    .Run();
You can find the complete example by this link.
While the load test is running, Aspire displays NBomber’s metrics in real time, helping you observe throughput, latency, and other key performance indicators as they evolve.