NBomber 6.7.0
NBomber 6.7.0 is here! This release introduces several improvements to scenario creation, warm-up configuration, test run metadata, and reporting. We’ve also fixed several issues in NBomber Cluster that could cause nodes to wait indefinitely under certain failure conditions.
In this post, we’ll walk through the key changes in NBomber 6.7.0 and explain how they can improve your load-testing workflows. We’ll cover NBomber Studio in a separate post.
Let’s take a closer look.
HTML Report
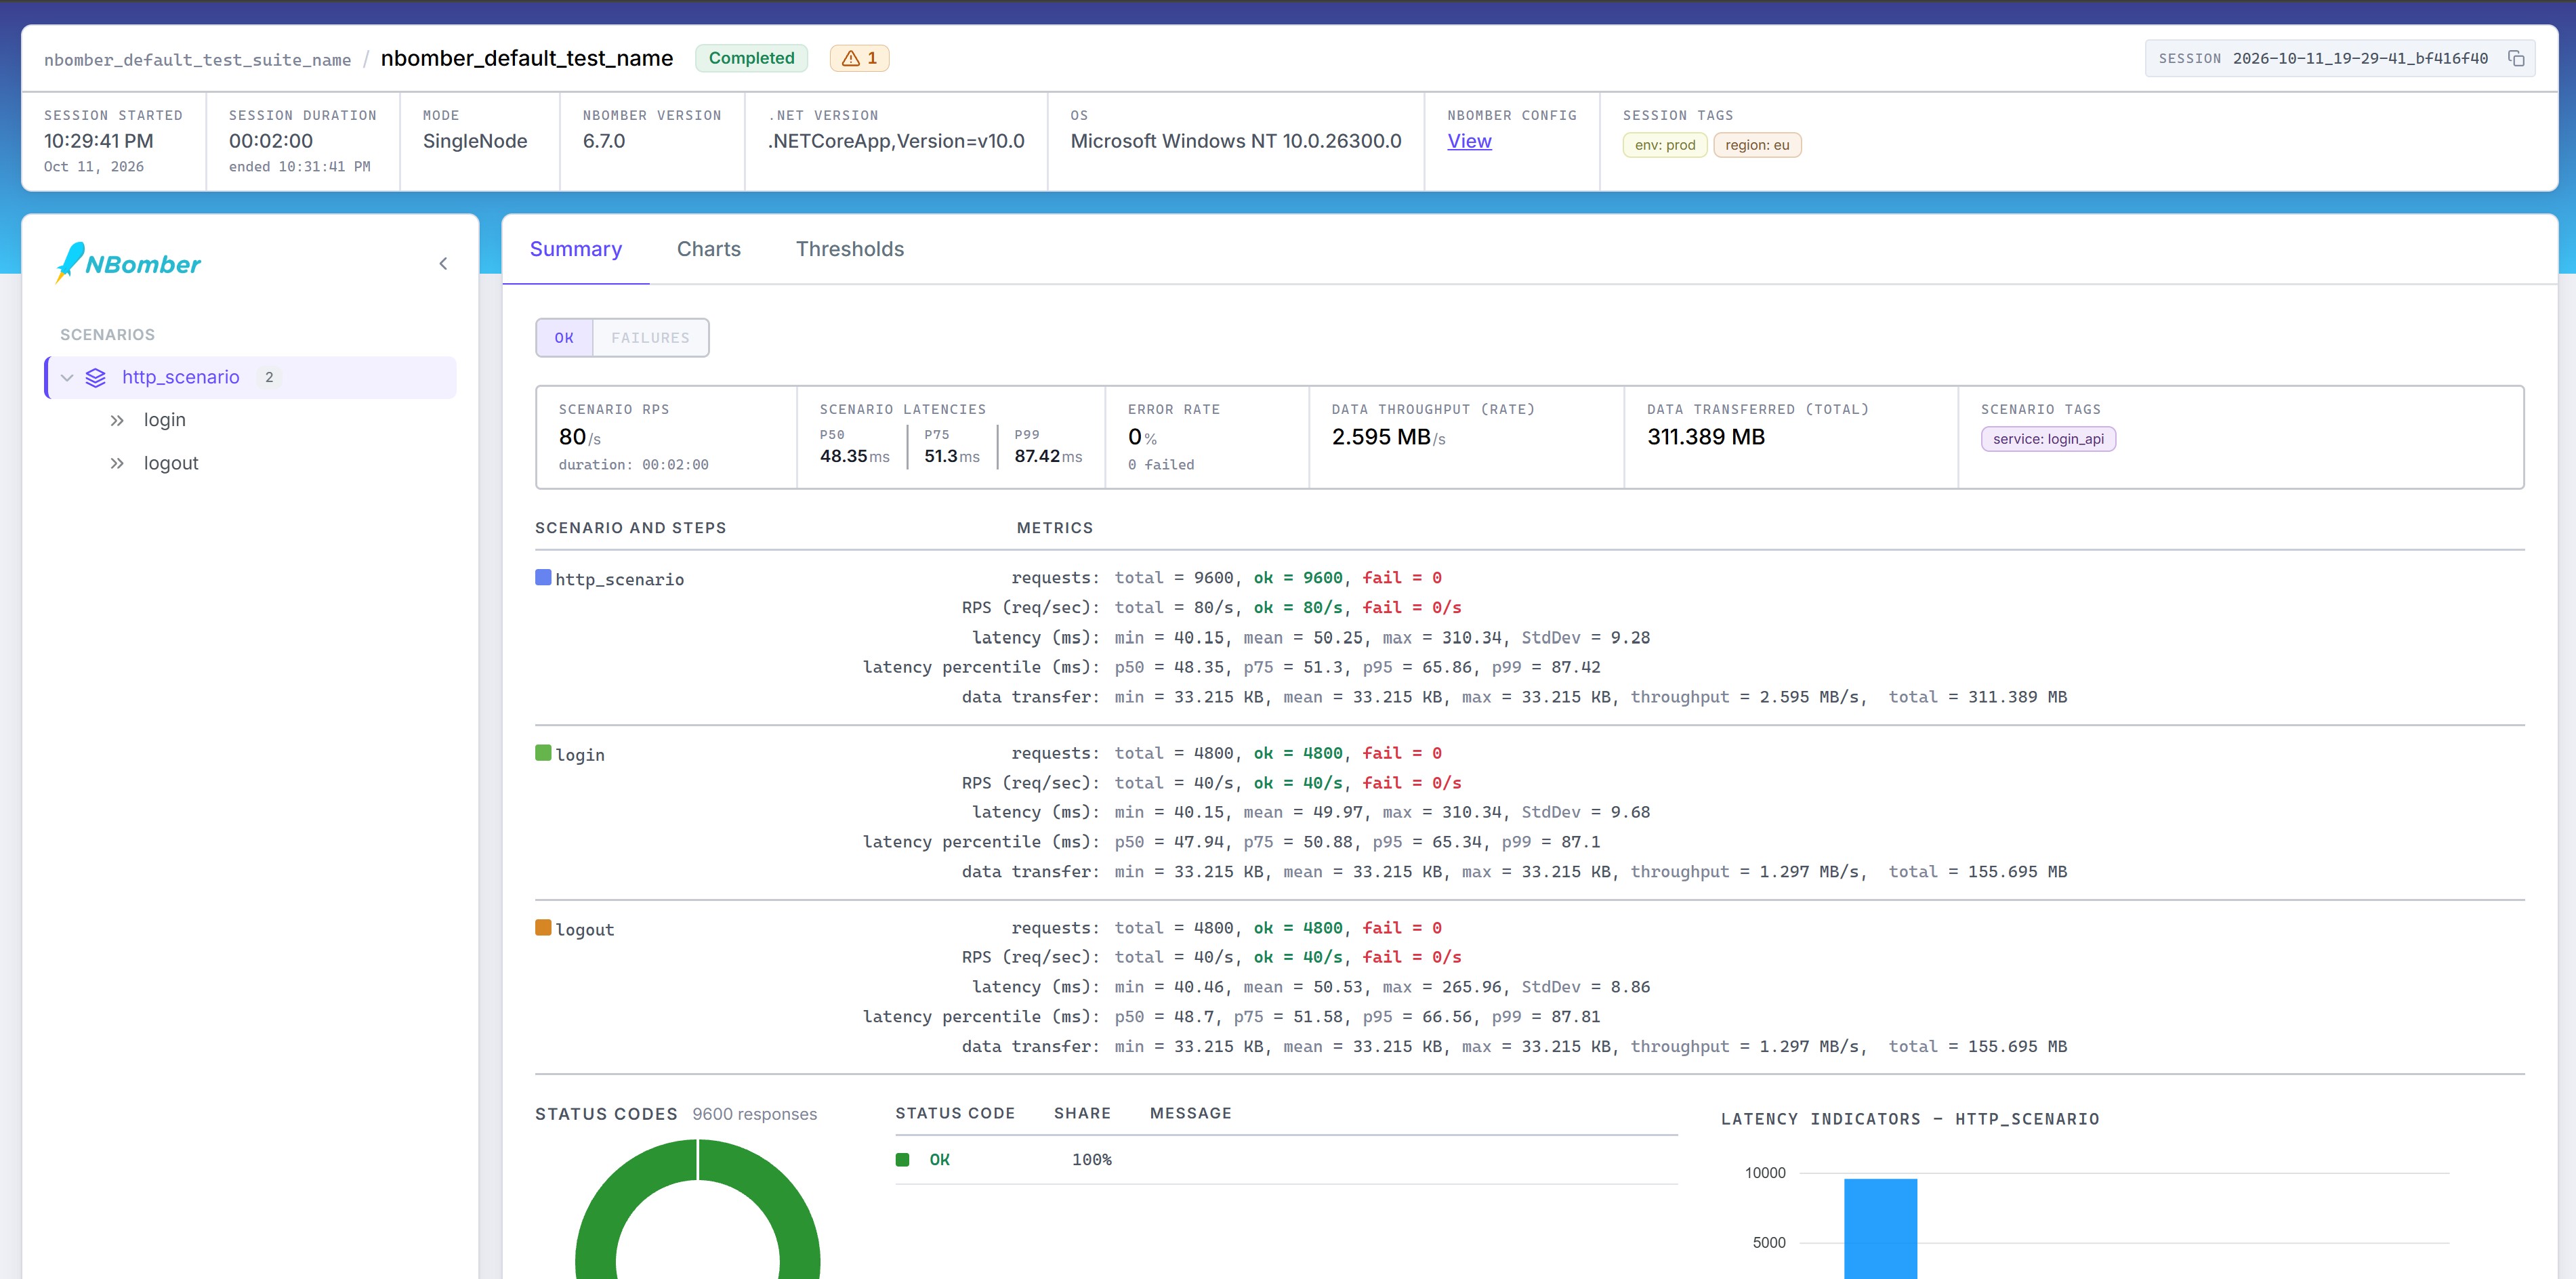
We continued to align the HTML report with NBomber Studio. The report now has a new layout, a richer summary, and support for the new tags. If you want, you can open it to see the changes.
- New session info panel. The top of the report shows the main facts about the test run: the test suite and test name, the session status, the start time, the duration, the mode (single node or cluster), and the NBomber, .NET, and OS versions. You can copy the session ID with one click.
- Tags. The report shows the new session tags in the session info panel and the scenario tags in the Summary tab. Each tag is a colored chip. When there are too many tags to fit, a
+Nbutton opens a popup with the full list. - New navigation. A new sidebar with the scenario and step tree replaces the old one. You can collapse it or drag its border to resize it. The report content is now in three tabs:
Summary,Charts, andThresholds. - All charts in one tab. The
Chartstab groups the scenario metrics, the custom metrics, and the .NET process metrics. Use the toggle at the top to switch between them. - Hints and NBomber config in the session info panel. The hints are now in a popover next to the session status. If the test used a JSON config, click
Viewto see it in a modal window. - Improved Thresholds table. Each threshold shows its scenario and step, an
Ok/Failbadge, the check expression, the exception message (if any), and the error count. - Visual refresh. The report has a new design with updated colors, fonts, and spacing. Long scenario and step names are truncated and show the full name in a tooltip.
Scenario with no Response
In NBomber, a scenario can contain zero or multiple steps. Each step produces its own Response, which NBomber uses to track execution results and collect metrics.
However, when a scenario contains multiple steps, the scenario body’s final Response adds no useful information (except you use special mode StatsBasedOnIterations and want to mark iteration as failed). If every step already returns its own result, returning Response.Ok() at the end of the scenario is just boilerplate.
For example, consider this scenario:
var scenario = Scenario.Create("my e-commerce scenario", async context =>
{
    await Step.Run("login", context, async () =>
    {
        return Response.Ok();
    });

    await Step.Run("logout", context, async () =>
    {
        return Response.Ok();
    });

    return Response.Ok();
});
Both login and logout already report their results independently. The final return Response.Ok(); is unnecessary in this case.
With NBomber 6.7.0, Scenario.Create introduces a new overload that allows the scenario function to return a plain Task, without requiring a Response.
The same scenario can now be written more concisely:
var scenario = Scenario.Create("my e-commerce scenario", async context =>
{
    await Step.Run("login", context, async () =>
    {
        return Response.Ok();
    });

    await Step.Run("logout", context, async () =>
    {
        return Response.Ok();
    });
});
When the scenario function returns without a Response, NBomber treats the iteration as successful, just as it does when the function returns Response.Ok().
What about scenarios without steps?
When a scenario has no steps, its Response is the primary source of iteration results. You can use it to specify the status code and payload size, or to mark the iteration as failed.
For example, this is useful when the scenario performs an HTTP request directly:
var scenario = Scenario.Create("http_scenario", async context =>
{
    var response = await httpClient.GetAsync("https://nbomber.com");

    return response.IsSuccessStatusCode
        ? Response.Ok(statusCode: response.StatusCode.ToString())
        : Response.Fail(statusCode: response.StatusCode.ToString());
});
In short, you can continue returning a Response when the scenario itself needs to report a result, while scenarios that rely on their steps can omit the redundant return value.
Custom Warm-up
A warm-up phase prepares the system under test before NBomber starts collecting the results of the main load test. It gives the application time to initialize, populate caches, JIT-compile code, and establish connections.
Warm-up results are excluded from the final report, so the main measurements reflect the system's behavior after this initial preparation.
Previously, NBomber used the same load simulation for both warm-up and the main test. The warm-up phase simply ran for a shorter period, controlled by WarmUpDuration.
This approach worked well for many scenarios, but it could cause problems when testing systems under high load.
Imagine that your main test injects 500 requests per second. With the previous behavior, the cold system would immediately receive the same request rate during warm-up. If the application wasn’t ready to handle that load, it could return errors or time out before the actual measurement phase began.
For example:
var scenario = Scenario.Create("http_scenario", async context =>
{
    // ...
    return Response.Ok();
})
// The warm-up runs at 500 RPS for 30 seconds
.WithWarmUpDuration(TimeSpan.FromSeconds(30))
.WithLoadSimulations(
    Simulation.Inject(
        rate: 500,
        interval: TimeSpan.FromSeconds(1),
        during: TimeSpan.FromMinutes(5))
);
With NBomber 6.7.0, you can configure a separate load profile for the warm-up phase using the new WithWarmUpSimulations method.
This allows you to prepare the system gradually before applying the full load. For example, the following configuration ramps the warm-up load up to 500 requests per second over 30 seconds, then runs the main test at a constant rate of 500 requests per second:
var scenario = Scenario.Create("http_scenario", async context =>
{
    // ...
    return Response.Ok();
})
.WithWarmUpSimulations(
    Simulation.RampingInject(
        rate: 500,
        interval: TimeSpan.FromSeconds(1),
        during: TimeSpan.FromSeconds(30))
)
.WithLoadSimulations(
    Simulation.Inject(
        rate: 500,
        interval: TimeSpan.FromSeconds(1),
        during: TimeSpan.FromMinutes(5))
);
This gives you more control over how the system is prepared for the main test, without changing the load profile used for the actual measurements.
A few details are worth keeping in mind:
- Warm-up duration: When warm-up simulations are configured, they run for their full planned duration. In the example above, the warm-up lasts 30 seconds.
WarmUpDurationbehavior: If you configure warm-up simulations, NBomber ignoresWarmUpDuration. If both are set, NBomber logs a warning.- Disabling warm-up: Calling
WithoutWarmUp()disables the warm-up phase and removes the configured warm-up simulations.
You can also configure warm-up simulations without changing your test code by using the WarmUpSimulationsSettings field in the JSON config.
For more information, see the Scenario WarmUp documentation.
Tags

Load tests are often executed across multiple environments, regions, and application builds. Comparing their results can become difficult when the reports don’t tell you which configuration produced each measurement.
NBomber 6.7.0 introduces tags: key/value pairs that you can attach to an entire test run or to an individual scenario. Tags let you identify test runs and filter or group results in reports, reporting sinks, and dashboards.
There are two levels of tags:
- Session tags describe the entire test run. For example,
env=prodorregion=eu. - Scenario tags describe an individual scenario. For example,
team=paymentsorservice=billing.
This separation lets you combine run-level metadata with scenario-specific information.
Adding tags in code
You can attach tags directly to a scenario using WithTags:
var scenario = Scenario.Create("payment_scenario", async context =>
{
    // ...
    return Response.Ok();
})
.WithTags(("team", "payments"), ("service", "billing"));
To add tags to the entire test run, configure them on NBomberRunner:
NBomberRunner
    .RegisterScenarios(scenario)
    .WithTags(("env", "prod"), ("region", "eu"))
    .Run();
You can also configure tags through the JSON config or the --tags CLI argument, making it possible to apply metadata without modifying your test code.
For configuration details and examples, see the Tags documentation.
Reporting Sinks: Data Transfer Rate and Tags
In this release, we updated all the official reporting sinks: InfluxDB, TimescaleDB, Datadog, and OpenTelemetry. These sinks now write the new data transfer rate metric, the tags, and the status codes for each step. To get the latest behavior, update your sink packages to the newest versions.
Tags
The sinks merge the session tags and the scenario tags and add them to every data point.
var influxDbSink = new InfluxDBSink();

var scenario = Scenario.Create("payment_scenario", async context =>
{
    // ...
    return Response.Ok();
})
.WithTags(("team", "payments"), ("service", "billing"));

NBomberRunner
    .RegisterScenarios(scenario)
    .WithTags(("env", "prod"), ("region", "eu"))
    .WithReportingSinks(influxDbSink)
    .LoadInfraConfig("infra-config.json")
    .Run();
In this example, each data point for payment_scenario includes the tags env=prod, region=eu, team=payments, and service=billing. In Grafana, Datadog, or any OpenTelemetry backend, you can use these tags to filter and group metrics. For example, you can compare env=staging with env=prod on the same dashboard.
Status codes per step
Before this release, the InfluxDB, Datadog, and OpenTelemetry sinks wrote status codes only per scenario. Now they write status codes for each step using the step tag.
CSV report: simulation name and value
The CSV report is handy when you want to process test results with your own tools—for example, Excel, a Python script, or a database. Before this release, the CSV report did not show the load simulation used by the scenario.
In this release, the CSV report includes two new columns:
simulation_name: the name of the load simulation, for exampleinject,keep_constant, orramping_inject.simulation_value: the load value. For open simulations, this is the rate. For closed simulations, it is the number of copies (virtual users).
Cluster fixes: infinite waiting
Before this release, NBomber Cluster nodes could wait forever in some failure scenarios. If an Agent did not receive commands from the Coordinator node, it stayed stuck indefinitely. The same was true when the NATS server was unavailable or when the Coordinator and Agents used different ClusterId values. In those cases, the nodes kept retrying, and a CI/CD job could remain stuck until the pipeline timed out.
This release fixes those issues by adding the missing timeouts.
What's Next?
Thank you for your interest in NBomber and for being part of our community! We hope these improvements make your load-testing workflows more flexible, insightful, and reliable. Stay tuned for more updates. In our next post, we'll take a closer look at the latest improvements in NBomber Studio.
Happy load testing!