NBomber v6.2.0


In the NBomber v6.2.0 release, we focused primarily on improvements to cluster mode, and we also introduced several useful enhancements to the HTML Report.
HTML Report improvements
One of the invisible but important changes in the new HTML Report is that it has been completely rewritten in TypeScript. For a long time, we used vanilla JavaScript with Vue, but over time it became difficult to manage complexity, reason about the code, and maintain correctness. Moving to TypeScript gives us type safety and makes future development more sustainable.
Now, let’s look at the visible improvements 🙂
Status code chart colors
Previously, the colors for the status code chart were automatically selected by the charting library. This made it difficult to clearly distinguish successful responses from errors. In this release, we fixed that by introducing two distinct color groups—green for successful responses and red for errors—with slightly different shades.
This change significantly improves the clarity and readability of the status code chart.
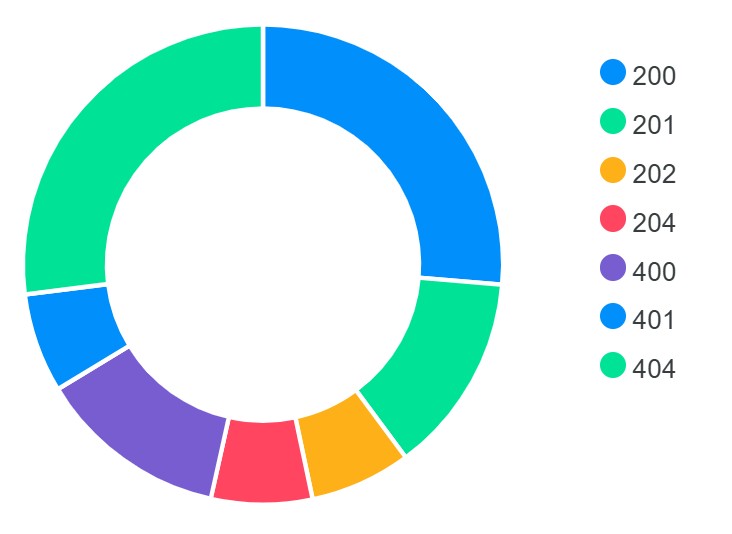
Before: status codes chart
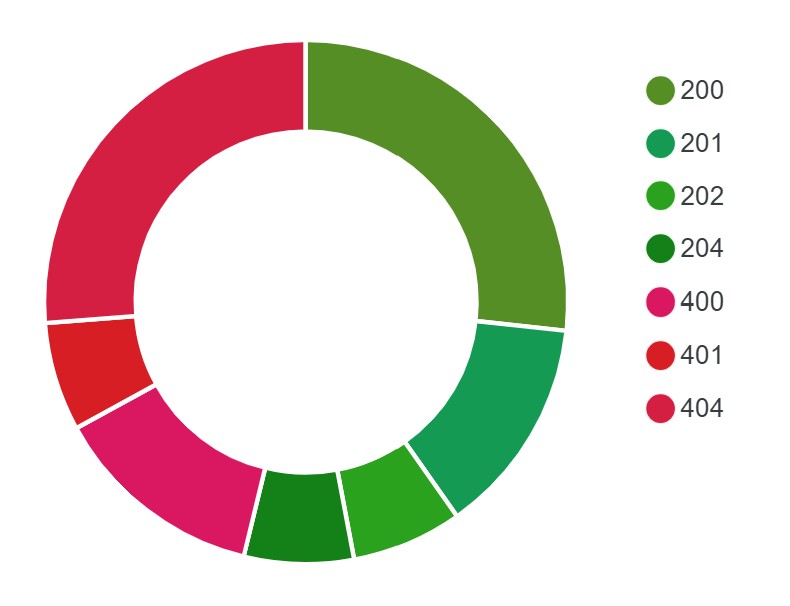
After: status codes chart
Advanced options
This feature allows you to include custom metrics and plot them on the Throughput chart.
Metrics filter
The metrics filter provides a simple text box that allows you to quickly find and focus on the metrics you are interested in.
Chart size
With View mode, you can adjust the size of charts to make analysis more convenient and readable.
Full-screen mode
Full-screen mode allows you to open any chart in full-screen view for more detailed analysis.
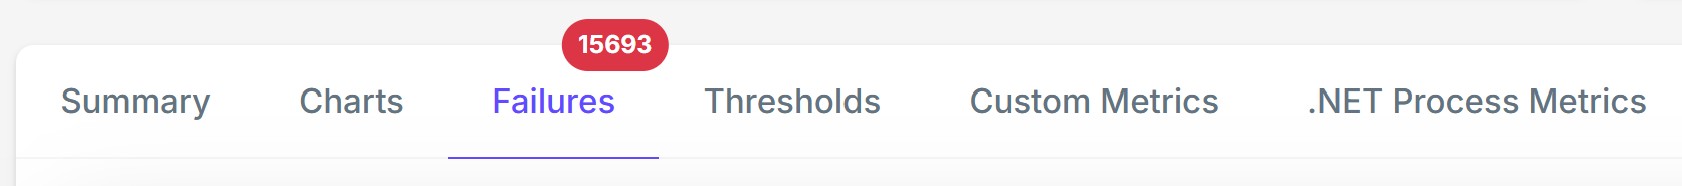
Failures tab
To make failures more visible during test analysis, we added a red badge on the Failures tab that displays the aggregated failure count.
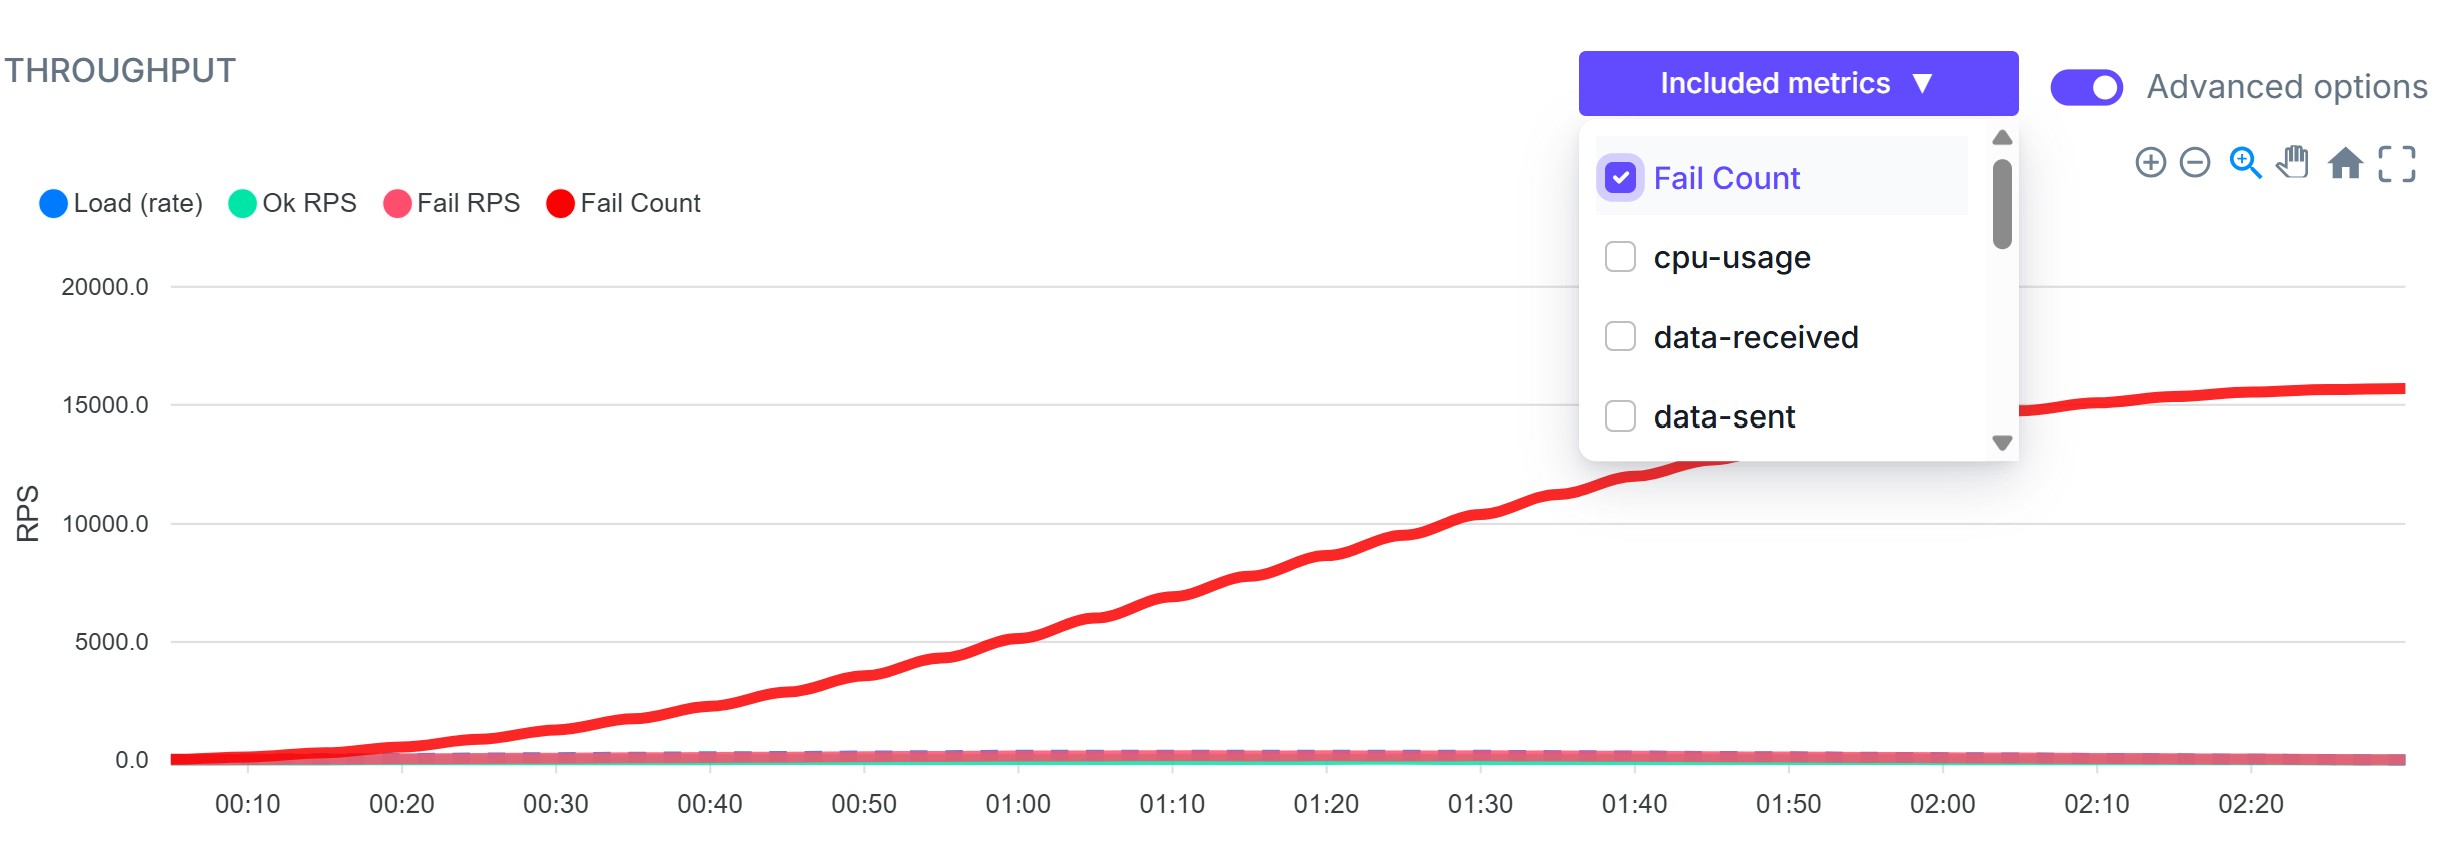
Aggregated failure counter
In some cases, it’s useful not only to see the Fail RPS, but also the cumulative number of failures over time. Using the Advanced Options feature, you can now include the aggregated failure count directly on your chart.
NBomber Cluster improvements
As you may already know, NBomber supports cluster mode, which allows you to run load tests in a distributed fashion. In this release, we introduced two major improvements focused on simplicity and flexibility.
Cluster via CLI args
Previously, creating a cluster required defining and loading a JSON Config file that described the cluster topology. For example, the following configuration defines a cluster with one Coordinator and two Agents, all running the test_scenario.
"ClusterSettings": {

    "AutoCluster": {
        "ClusterId": "default",
        "NATSServerURL": "nats://localhost",

        "Coordinator": {
            "TargetScenarios": ["test_scenario"]
        },

        "Agent": {
            "TargetScenarios": ["test_scenario"],
            "AgentsCount": 2
        }
    }
}
You then had to load this configuration on each NBomber node to form a cluster (in our example, three-node cluster: 1 Coordinator + 2 Agents):
# start node 1
dotnet my-nbomber-test.dll --config=config.json

# start node 2
dotnet my-nbomber-test.dll --config=config.json

# start node 3
dotnet my-nbomber-test.dll --config=config.json
In v6.2.0, you can now configure the cluster via CLI arguments, without creating or loading a JSON configuration file. This is especially useful when you're preparing a CI/CD job and want to run your regular single-node NBomber test in cluster mode on K8s. No JSON config is required—just pass CLI arguments and you’re ready to go:
# --target sets TargetScenarios for both Coordinator and Agents

# to start node 1
dotnet my-nbomber-test.dll --target=test_scenario --cluster-id=default --cluster-agents-count=2 --cluster-nats-url=nats://localhost

# to start node 2
dotnet my-nbomber-test.dll --target=test_scenario --cluster-id=default --cluster-agents-count=2 --cluster-nats-url=nats://localhost

# to start node 3
dotnet my-nbomber-test.dll --target=test_scenario --cluster-id=default --cluster-agents-count=2 --cluster-nats-url=nats://localhost
All of the above commands can also be used to override settings loaded from config.json.
In this example, --target overrides TargetScenarios for both Coordinator and Agents, and --cluster-agents-count sets a new value for AgentsCount.
dotnet my-nbomber-test.dll --config=config.json --target=test_scenario --cluster-agents-count=5
If you want to run different scenarios on the Coordinator and Agents, this can also be done via CLI arguments. In the following example, "scenario_1" runs on the Coordinator and "scenario_2" runs on the Agents:
dotnet my-nbomber-test.dll \
    --cluster-coordinator-target=scenario_1 \
    --cluster-agent-target=scenario_2 \
    --cluster-id=default \
    --cluster-agents-count=5 \
    --cluster-nats-url=nats://localhost
A full list of available CLI options can be found at the following link.
Simplification of Manual cluster mode
For ManualCluster mode — which provides more flexibility than AutoCluster by allowing explicit control over scenario placement — we introduced a small but important simplification.
AgentGroups are now optional. If you don’t need fine-grained placement, you can simply specify TargetScenarios, making ManualCluster nearly as simple to configure as AutoCluster.
Here is the updated type definition for ManualCluster configuration:
type ManualAgentSettings = {
    AgentGroups: (AgentGroupSettings list) option
    TargetScenarios: (string list) option
    AgentsCount: int
}

type ManualClusterSettings = {
    ClusterId: string
    NATSServerURL: string
    Coordinator: ManualCordSettings
    Agent: ManualAgentSettings
}
ManualCluster using only TargetScenarios
This configuration is similar to AutoCluster but gives you manual control over which node runs as Coordinator and which runs as an Agent. In AutoCluster, this role assignment is handled automatically via leader election.
"ClusterSettings": {

    "ManualCluster": {
        "ClusterId": "test_cluster",
        "NATSServerURL": "nats://localhost",

        "Coordinator": {
            "TargetScenarios": ["test_scenario_1"]
        },

        "Agent": {
            "TargetScenarios": ["test_scenario_2"],
            "AgentsCount": 1
        }
    }
}
# start Coordinator node
dotnet my-nbomber-test.dll --config=config.json --cluster-node-type=coordinator

# start Agent node
dotnet my-nbomber-test.dll --config=config.json --cluster-node-type=agent
ManualCluster with AgentGroups
If you need more flexible scenario placement, AgentGroups are still fully supported.
"ClusterSettings": {

    "ManualCluster": {
        "ClusterId": "test_cluster",
        "NATSServerURL": "nats://localhost",

        "Coordinator": {
            "TargetScenarios": ["publish_kafka_scenario"]
        },

        "Agent": {
            "AgentGroups": [
                { "AgentGroup": "readers", "TargetScenarios": ["read_db_scenario"] },
                { "AgentGroup": "writers", "TargetScenarios": ["write_dbScenario"] }
            ],
            "AgentsCount": 4
        }
    }
}
# start Coordinator node
dotnet my-nbomber-test.dll --config=config.json --cluster-node-type=coordinator

# start 2 Agent nodes under "readers" AgentGroup
dotnet my-nbomber-test.dll --config=config.json --cluster-node-type=agent --cluster-agent-group=reads
dotnet my-nbomber-test.dll --config=config.json --cluster-node-type=agent --cluster-agent-group=reads

# start 2 Agent nodes under "writers" AgentGroup
dotnet my-nbomber-test.dll --config=config.json --cluster-node-type=agent --cluster-agent-group=writes
dotnet my-nbomber-test.dll --config=config.json --cluster-node-type=agent --cluster-agent-group=writes
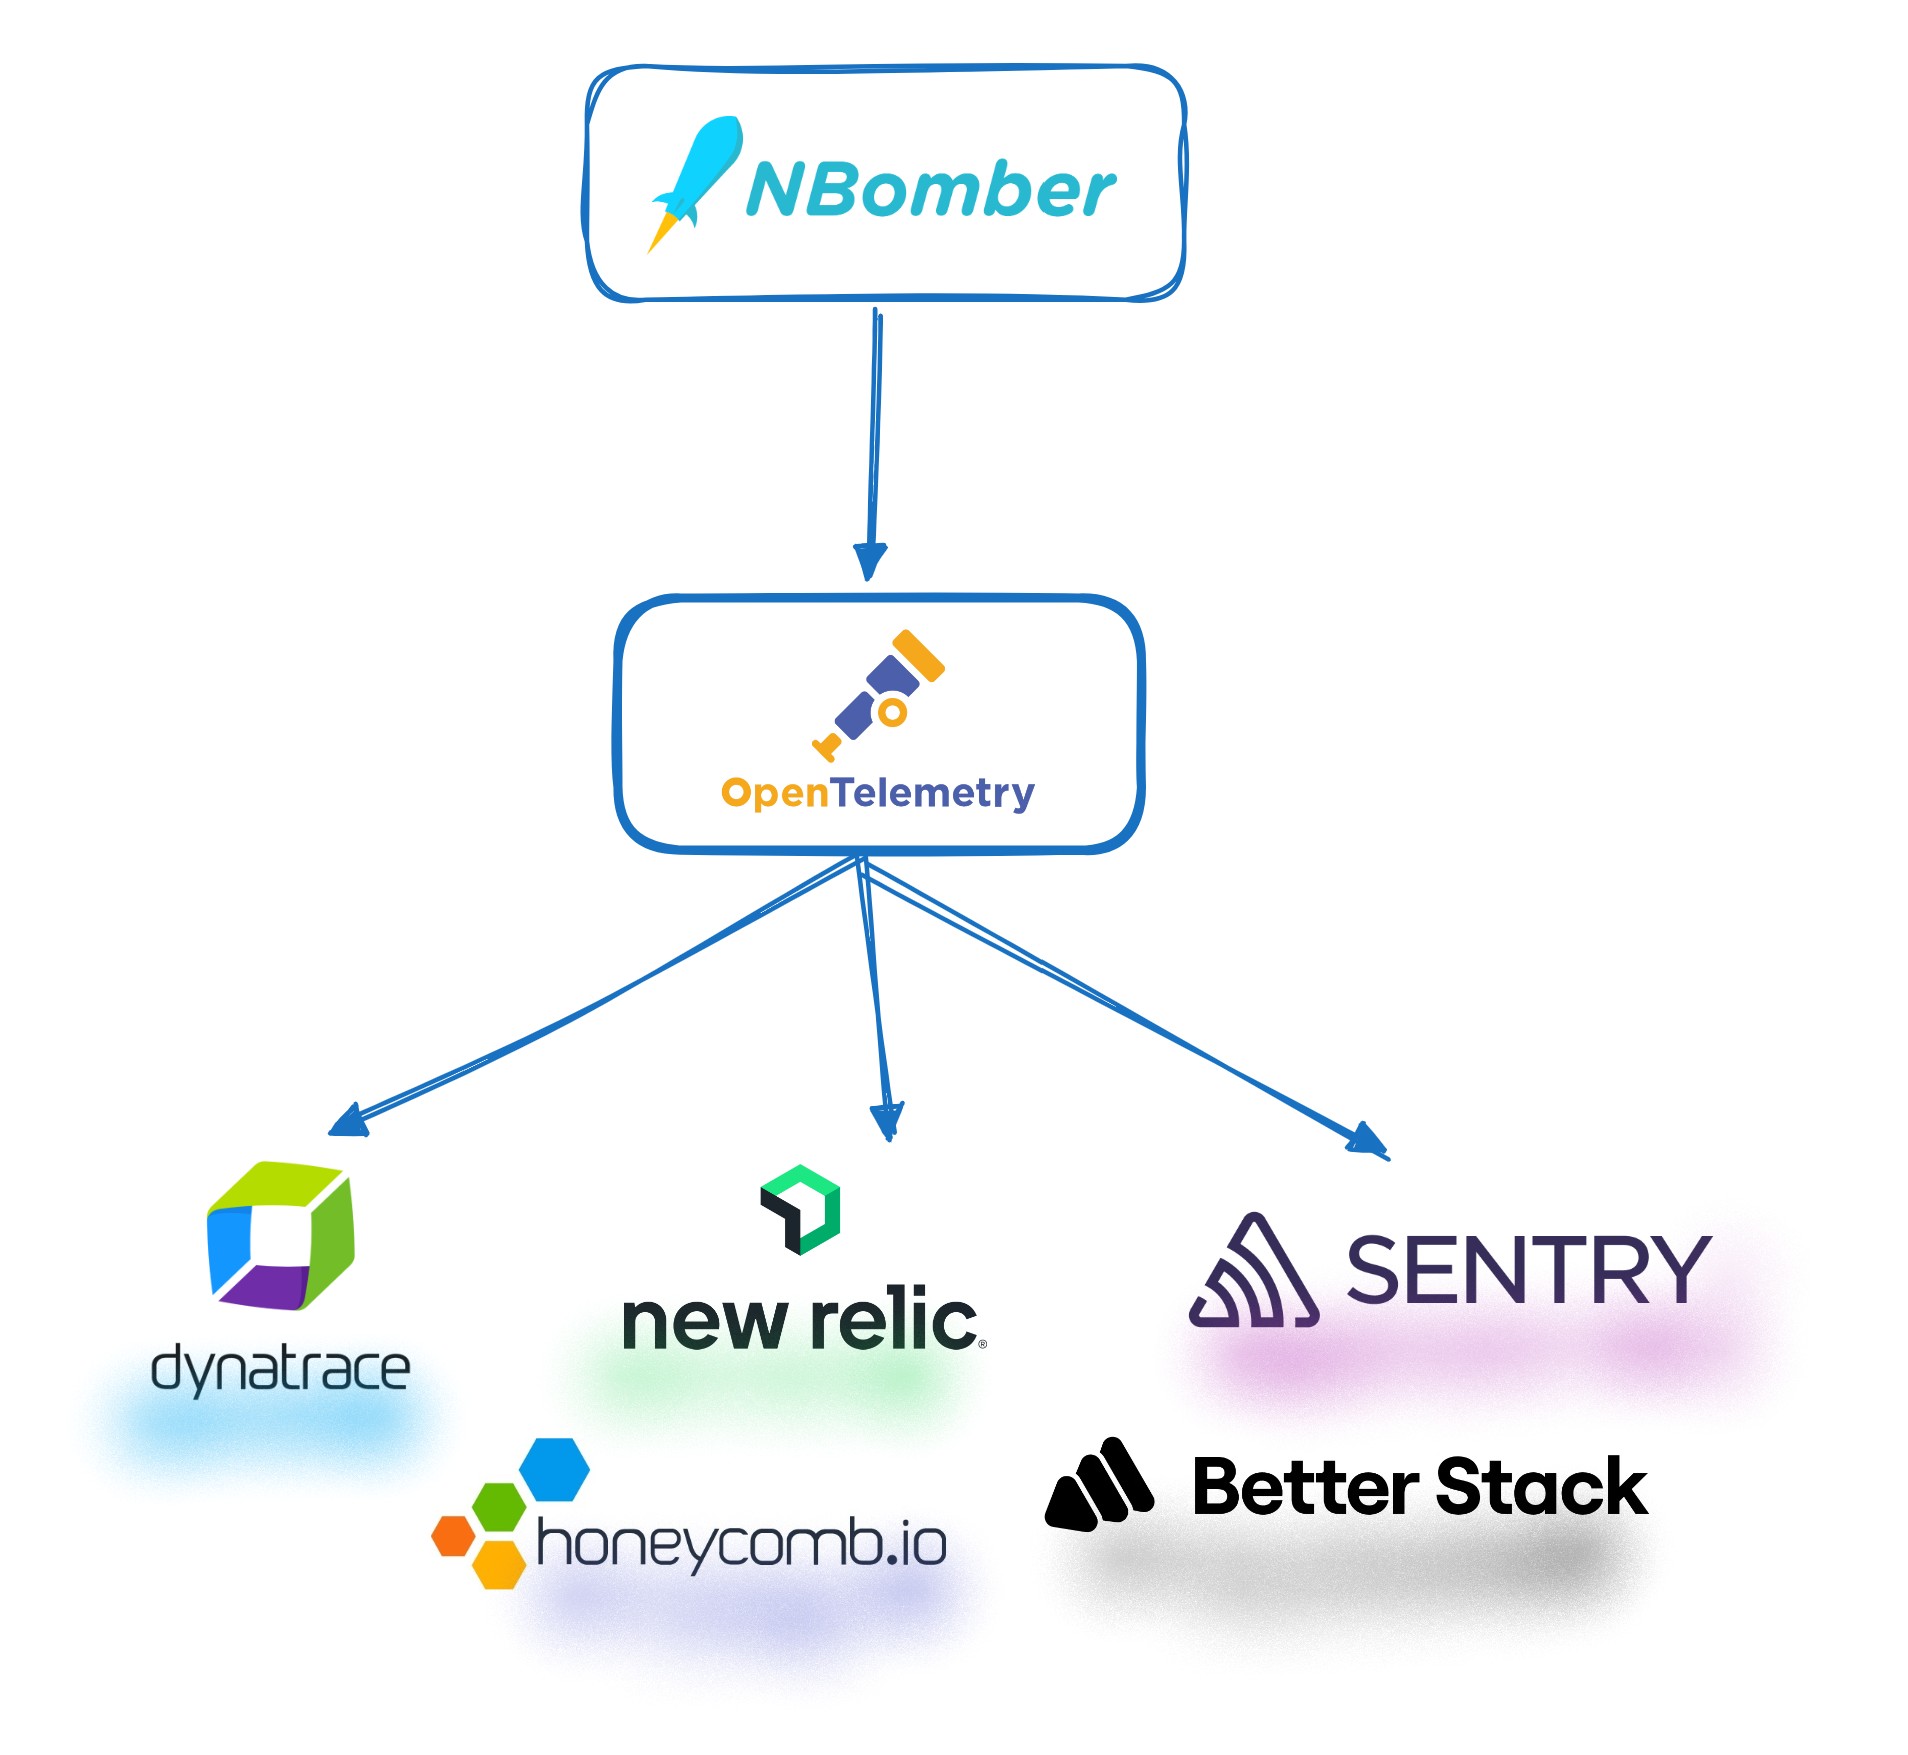
OpenTelemetry Reporting Sink
We released a new OpenTelemetry Reporting Sink that allows you to stream real-time NBomber metrics to any observability platform that supports the OpenTelemetry (OTel) protocol.
This effectively enables integration with the vast majority of modern observability platforms. Previously, we had to implement a dedicated reporting sink for each platform individually. Now, if you want to store NBomber metrics in a system like Azure Monitor (or many others), you can simply use the OpenTelemetry sink.
What's next
-
We are planning to release a new version of NBomber Studio soon—hopefully in February. This release will include several exciting features such as Compare Runs and Trends.
-
In parallel, we are finishing work on a highly anticipated feature for NBomber Studio: Load Testing in K8s. This will allow you to create and deploy load tests directly to Kubernetes from NBomber Studio, without requiring additional CI/CD jobs. We expect this to be released in late February or early March.
-
We have also started working on NBomber.YCSB, a port of the Yahoo Cloud Serving Benchmark (YCSB), which will allow you to generate popular synthetic workloads against your database and evaluate how well it handles load. Feel free to join and contribute! We have many exciting ideas ahead, and we believe this project will bring great value to the .NET community and beyond.
- Release Notes for v6.2.0
- Please follow our Roadmap page for upcoming releases.