NBomber 6.6.0
This release is mostly about stats and HTML reporting. We made these main changes:
- We reworked how NBomber calculates the scenario-level stats.
- We added the calculation of the data transfer throughput.
- We improved HTML report with a new data transfer chart.
- We made the console, TXT, and Markdown reports consistent.
- We made NBomber Cluster much easier to troubleshoot.
- We improved the logging.
HTML report improvements
We reworked the layout, the charts, and the tables to match the reporting of NBomber Studio.
The main change is the navigation. The session page now has a resizable tree of your scenarios and their steps on the left side. You select a scenario or step. Then the summary table, the status codes, and the charts show the data of this selection only. You can collapse the tree, or drag its border to change the width.
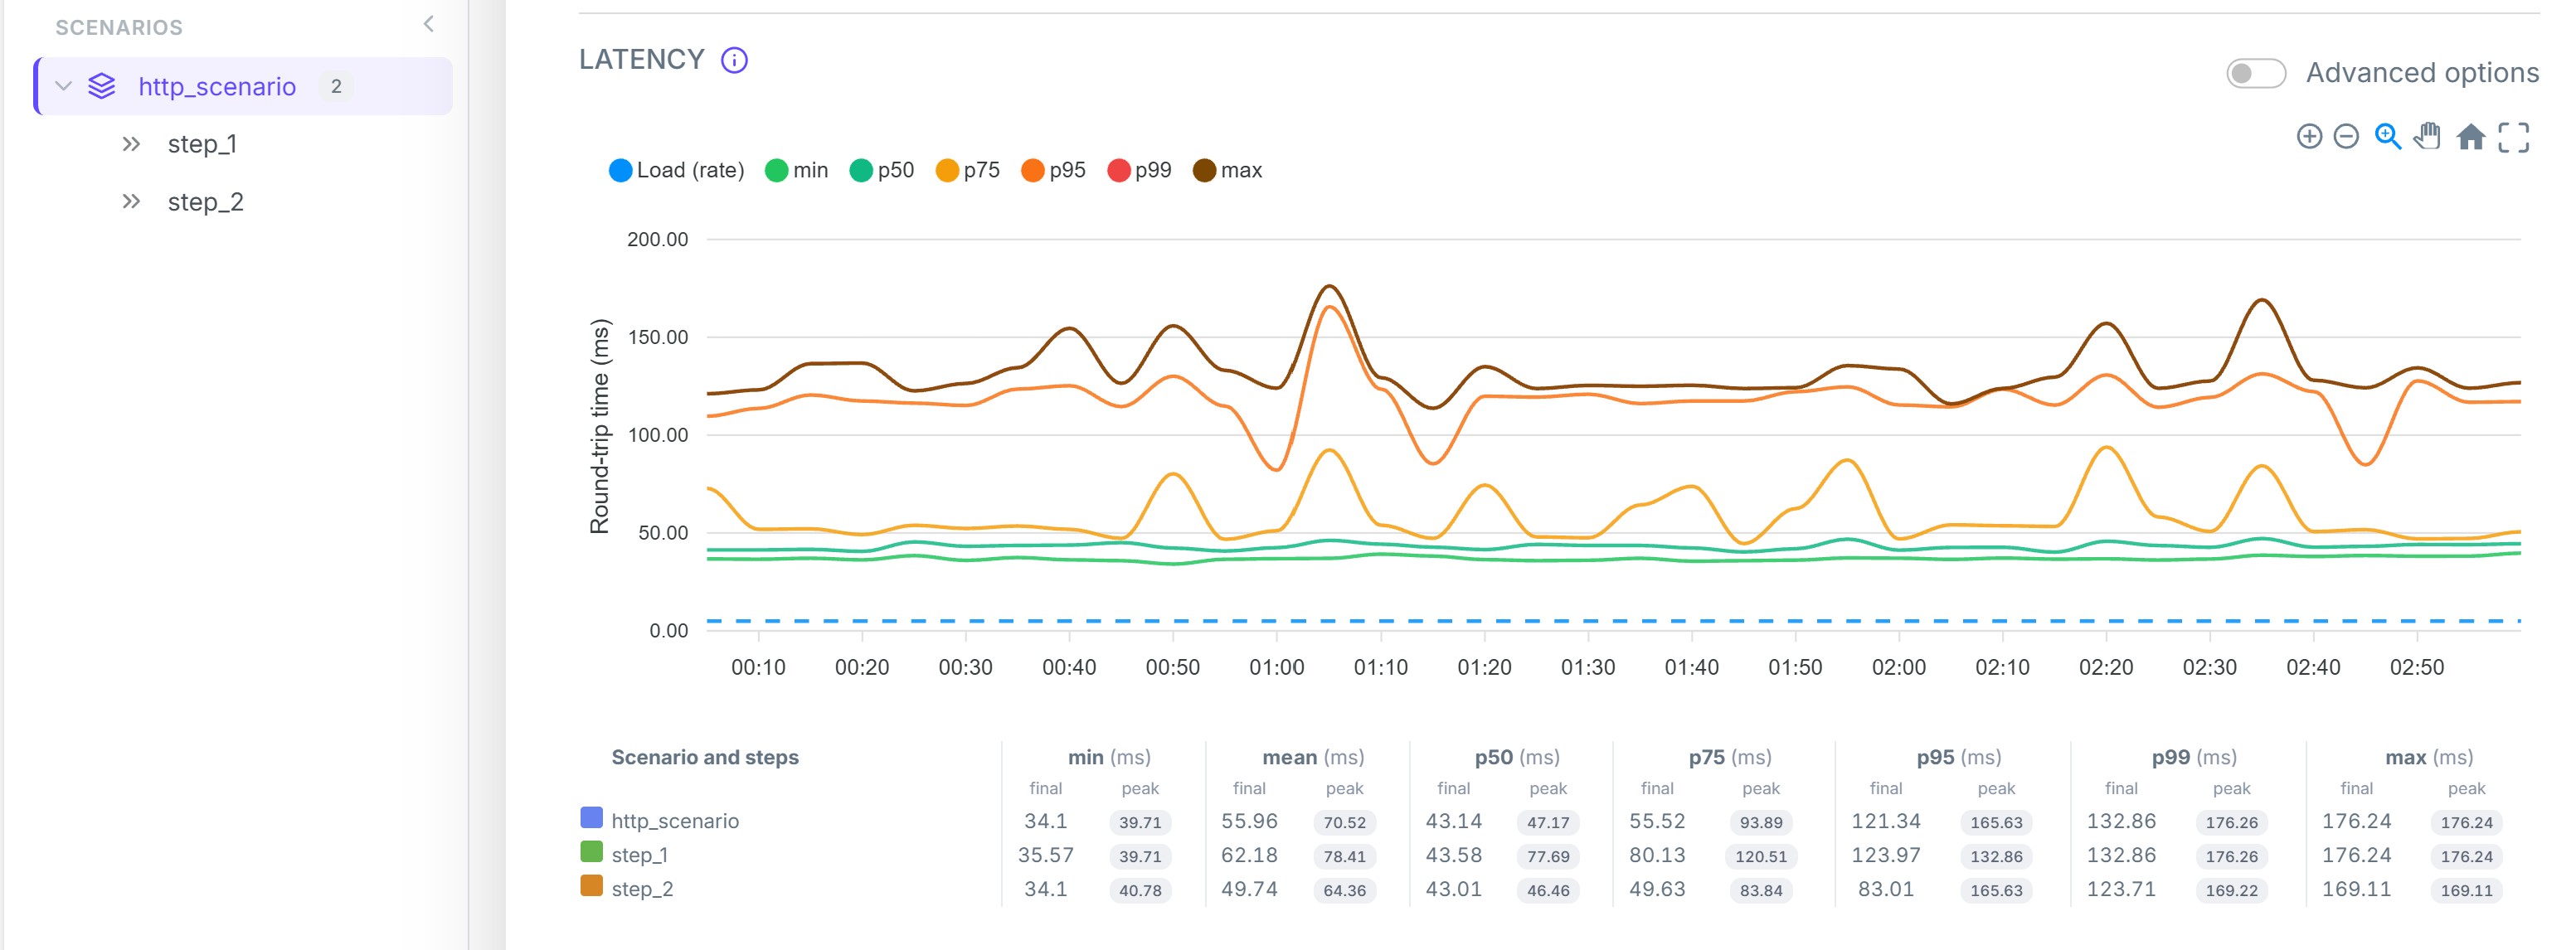
The other changes:
- A new Data Transfer chart. It shows the network throughput over time, for the total, the ok, and the fail requests. The chart selects the byte unit (KB, MB) from the peak value.
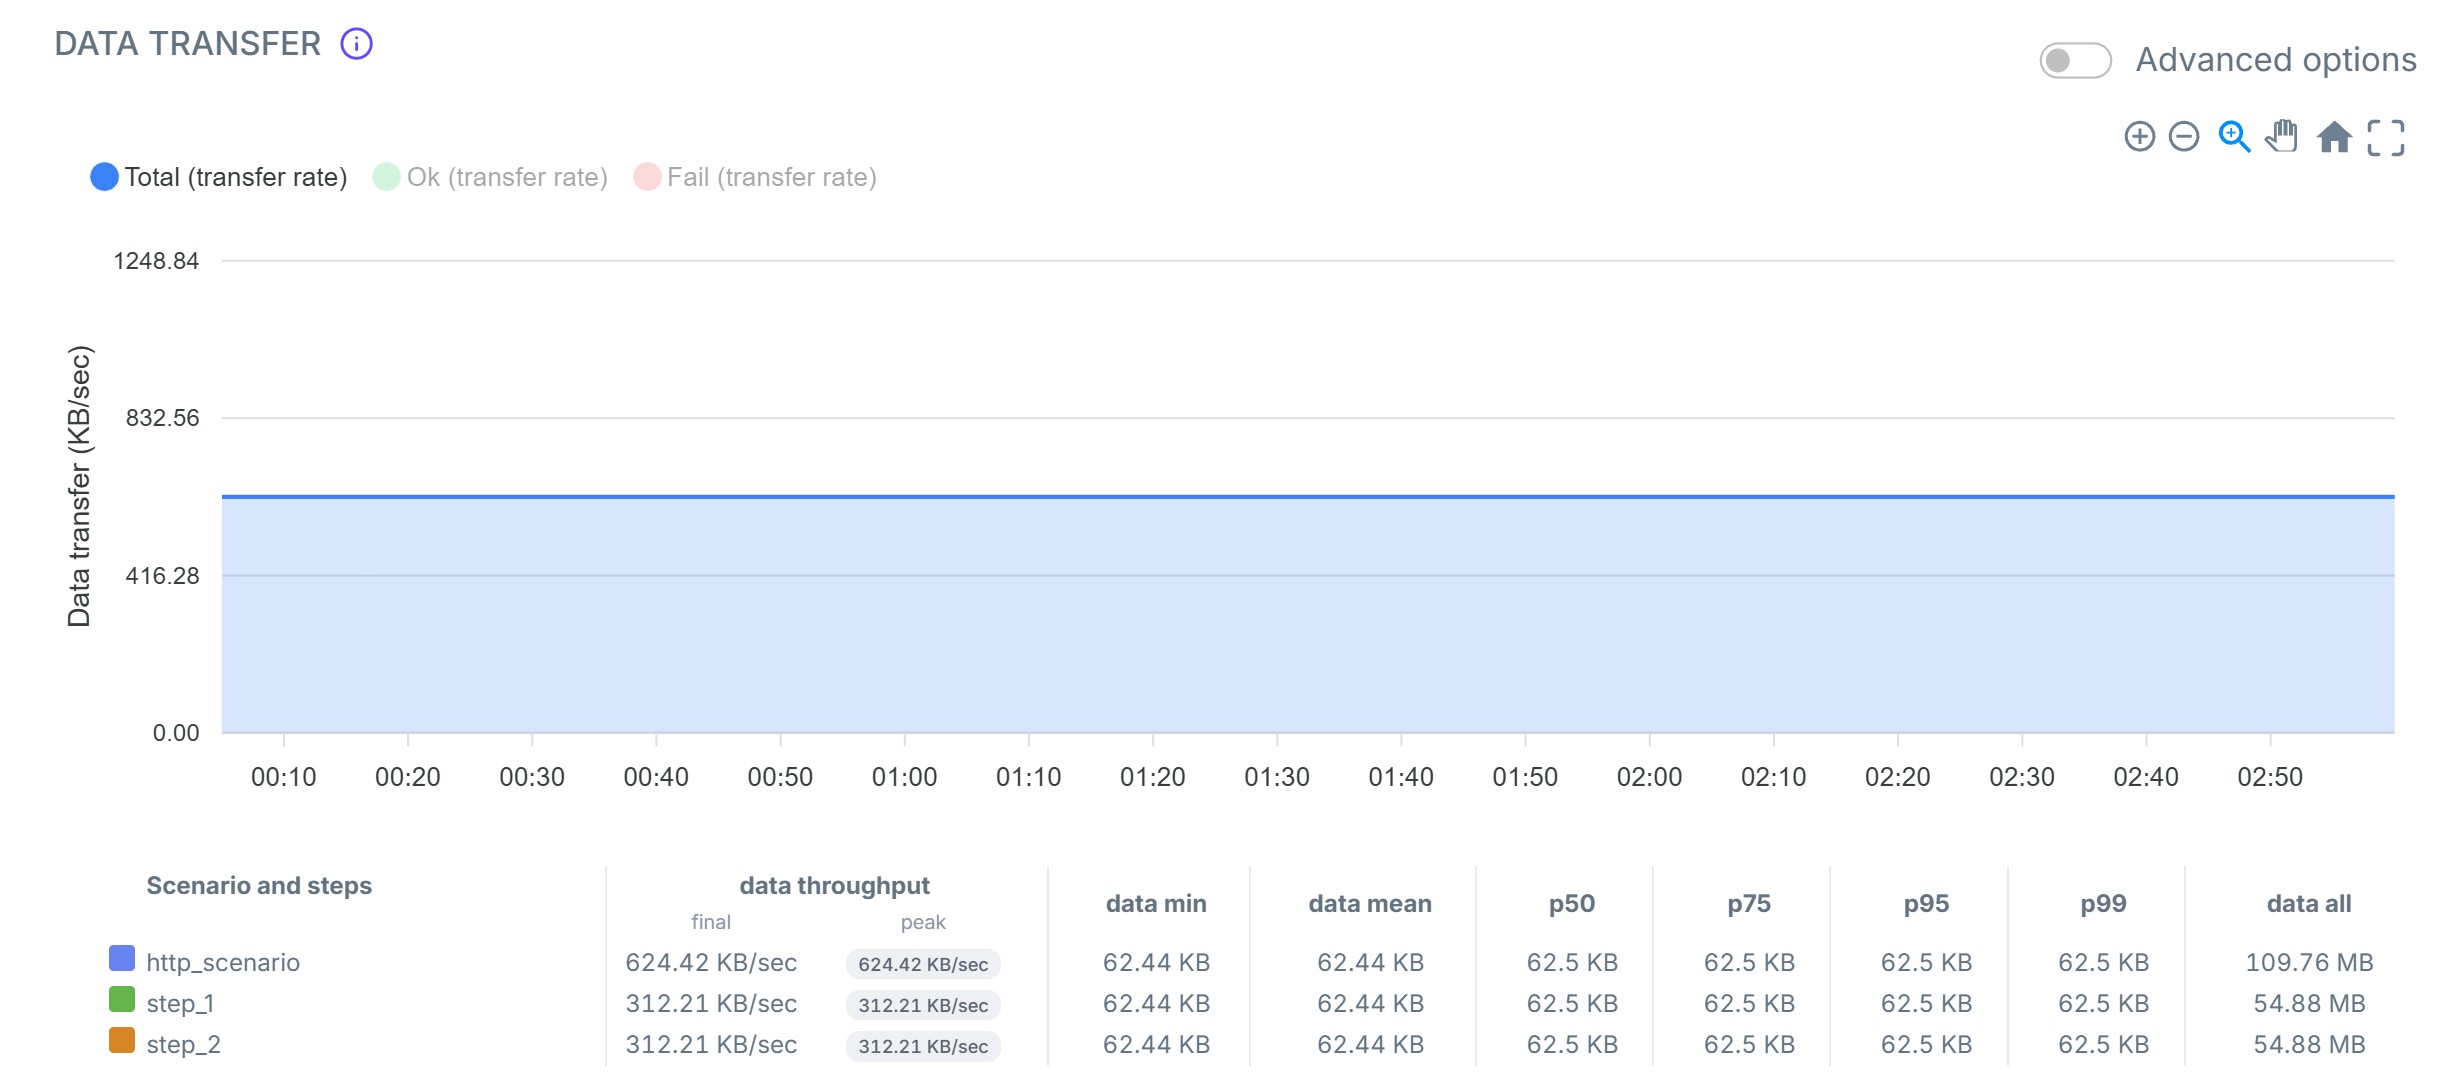
- A metric table under every chart. The Throughput, Latency, and Data Transfer charts each have a table below the chart. One row is one scenario or one step, with a color mark that matches the line on the chart. Each metric has a
finalvalue for the whole run and apeakvalue for the highest point of the run.

- Tooltips. An info icon near each chart title explains the chart. Each column header of a metric table explains its metric.
- A better chart scale. The charts calculate the maximum of the Y axis from the peak value. A custom metric with large values no longer flattens the main lines.
We also corrected several defects. The NBomber icon is correct now. The tooltips no longer stay on the screen after you switch tabs. The sticky table headers keep their position. The report also keeps the scroll position when you move between scenarios.
Improved reports formatting
The console, TXT, and Markdown reports now use one consistent shape for the counters. The request counts and the RPS are on separate rows. Each row shows total, ok, and fail side by side:
|           scenario name |test_scenario                                                            |
|                requests |total = 6000, ok = 5980, fail = 20                                       |
|           RPS (req/sec) |total = 200, ok = 199.3, fail = 0.7                                      |
|            latency (ms) |min = 1.2, mean = 4.8, max = 120.5, StdDev = 6.1                         |
| latency percentile (ms) |p50 = 4.1, p75 = 5.9, p95 = 12.4, p99 = 31.7                             |
|      data transfer (KB) |min = 1.2, mean = 4.5, max = 9.1, throughput = 850.3 KB/s, total = 42 MB |
These changes are small, but they remove the guesswork when you scan a report.
Reworked ScenarioStats
This is the most important change in this release. It changes the numbers that you see for a scenario that contains steps.
Before this release, NBomber built the scenario-level stats (ScenarioStats.Ok and ScenarioStats.Fail, printed as the global information row) from the scenario iteration measurements only. NBomber did not aggregate the step data. If your scenario had steps, all the work inside these steps was invisible at the scenario level:
- The scenario RPS counted the iterations, not the step requests.
- The scenario latency was the duration of the whole scenario iteration.
From version 6.6.0, when a scenario contains steps, the scenario-level stats aggregate all step measurements:
scnStats.Ok.Request.RPSis the sum of the RPS of all steps in the scenario.scnStats.Ok.Request.CountandscnStats.Fail.Request.Countare the sums of the ok and the fail step requests.- NBomber calculates the scenario latency and the percentiles from the step latencies, not from the scenario iteration duration.
- NBomber merges the scenario status codes from the step status codes. When the scenario has steps, NBomber ignores the status code of the scenario body.
- The scenario data transfer is the sum of the data transfer of all steps.
This change does not affect StepStats. NBomber always reports each step separately.
This basic example shows the difference. The scenario has 2 steps. The load simulation represents a constant rate: 10 requests per second, for a duration of 10 seconds.
var scenario = Scenario.Create("test_scenario", async ctx =>
{
    await Step.Run("step_1", ctx, async () =>
    {
        await Task.Delay(1000);
        return Response.Ok();
    });

    await Step.Run("step_2", ctx, async () =>
    {
        await Task.Delay(1000);
        return Response.Ok();
    });

    return Response.Ok();
})
.WithLoadSimulations(
    Simulation.Inject(10, TimeSpan.FromSeconds(1), TimeSpan.FromSeconds(10))
);
The previous NBomber versions print this result. The scenario reports 10 RPS, and the latency is the duration of one scenario iteration: p99 = 2030.59.
┌─────────────────────────┬─────────────────────────────────────────────────────────────┐
│      scenario and steps │ ok stats                                                    │
├─────────────────────────┼─────────────────────────────────────────────────────────────┤
│           scenario name │ test_scenario                                               │
│                requests │ total = 100, ok = 100, fail = 0                             │
│           RPS (req/sec) │ total = 10/s, ok = 10/s, fail = 0/s                         │
│            latency (ms) │ min = 1999.67, mean = 2014.44, max = 2029.89, StdDev = 8.76 │
│ latency percentile (ms) │ p50 = 2015.23, p75 = 2019.33, p95 = 2029.57, p99 = 2030.59  │
│                         │                                                             │
│               step name │ step_1                                                      │
│                requests │ total = 100, ok = 100, fail = 0                             │
│           RPS (req/sec) │ total = 10/s, ok = 10/s, fail = 0/s                         │
│            latency (ms) │ min = 999.2, mean = 1006.94, max = 1015.79, StdDev = 6.1    │
│ latency percentile (ms) │ p50 = 1004.54, p75 = 1014.27, p95 = 1015.3, p99 = 1015.81   │
│                         │                                                             │
│               step name │ step_2                                                      │
│                requests │ total = 100, ok = 100, fail = 0                             │
│           RPS (req/sec) │ total = 10/s, ok = 10/s, fail = 0/s                         │
│            latency (ms) │ min = 999.39, mean = 1007.37, max = 1015.7, StdDev = 6.4    │
│ latency percentile (ms) │ p50 = 1004.03, p75 = 1014.27, p95 = 1015.3, p99 = 1015.81   │
└─────────────────────────┴─────────────────────────────────────────────────────────────┘
NBomber 6.6.0 prints a different result for the scenario stats.
┌─────────────────────────┬────────────────────────────────────────────────────────────┐
│      scenario and steps │ ok stats                                                   │
├─────────────────────────┼────────────────────────────────────────────────────────────┤
│           scenario name │ test_scenario                                              │
│                requests │ total = 200, ok = 200, fail = 0                            │
│           RPS (req/sec) │ total = 20/s, ok = 20/s, fail = 0/s                        │
│            latency (ms) │ min = 999.3, mean = 1006.8, max = 1016.35, StdDev = 6.61   │
│ latency percentile (ms) │ p50 = 1003.01, p75 = 1014.27, p95 = 1015.3, p99 = 1016.32  │
│                         │                                                            │
│               step name │ step_1                                                     │
│                requests │ total = 100, ok = 100, fail = 0                            │
│           RPS (req/sec) │ total = 10/s, ok = 10/s, fail = 0/s                        │
│            latency (ms) │ min = 999.33, mean = 1005.97, max = 1016.15, StdDev = 6.44 │
│ latency percentile (ms) │ p50 = 1001.98, p75 = 1014.27, p95 = 1015.3, p99 = 1015.3   │
│                         │                                                            │
│               step name │ step_2                                                     │
│                requests │ total = 100, ok = 100, fail = 0                            │
│           RPS (req/sec) │ total = 10/s, ok = 10/s, fail = 0/s                        │
│            latency (ms) │ min = 999.3, mean = 1007.62, max = 1016.35, StdDev = 6.67  │
│ latency percentile (ms) │ p50 = 1004.03, p75 = 1014.27, p95 = 1015.3, p99 = 1016.32  │
└─────────────────────────┴────────────────────────────────────────────────────────────┘
The scenario now reports 20 RPS (the aggregated RPS of the 2 steps) instead of 10 RPS. This data is a true summary of the load that you produce, and the step stats add up to it.
This change does not affect the scenarios without steps. There are no steps, so there is nothing to aggregate.
If you want the previous behavior, you can enable it for each scenario separately:
Scenario.Create("test_scenario", async ctx => ...)
        .WithStatsBasedOnIterations(true);
You can also set this option in the JSON config:
{
    "GlobalSettings": {

        "ScenariosSettings": [
            {
                "ScenarioName": "test_scenario",

                "StatsBasedOnIterations": true
            }
        ]

    }
}
Read the documentation of this option for more information.
This change may affect your assertions. If you assert on ScenarioStats (thresholds, custom checks), check your expectations again after you upgrade.
Data transfer throughput
We added BytesPerSecond to DataTransferStats (#992). Until now, NBomber reported only the total transferred size. To get the network throughput, you had to divide this size by the duration yourself.
This property is available on the DataTransfer stats:
var throughput = stats.ScenarioStats[0].Ok.DataTransfer.BytesPerSecond;
NBomber also prints this value in the live status table and in the final reports:
data transfer (KB): min = 1.2, mean = 4.5, max = 9.1, throughput = 850.3 KB/s, total = 42 MB
The CSV report has two new columns: data_transfer_bytes_per_sec and fail_data_transfer_bytes_per_sec.
Cluster improvements
- Agent IDs are now numbers. The Coordinator assigns a short numeric ID to each Agent, instead of a GUID. The log files, the folders, and the cluster reports are now much easier to read and to correlate.
- Fixed the early stop in cluster mode. When a session stopped before the planned duration, NBomber calculated the final RPS and throughput of an Agent against the planned duration. As a result, these values were too low. Now NBomber calculates them against the duration that the Agent executed.
- The Coordinator can now gather every Agent's log files into one place. Logs land in
reportFolder/agents_logs/agentId
Improved logging
We reworked logging around a new internal NBomberLogger:
- Before the session starts, NBomber holds the log events in memory (configuration parsing, cluster connection, validation). NBomber then writes these events to the session log file. Before this release, these events went to a temporary session folder that you had to find separately.
- The temporary session IDs and the temporary log folders are gone.
- Each session writes one log file with a meaningful name:
nbomber-log-<timestamp>.txtfor a single node,coordinator-log-<timestamp>.txtfor the Coordinator, andagent-<id>-log-<timestamp>.txtfor an Agent. NBomber no longer rolls the log file every hour in one session.
If you supply your own Serilog configuration, nothing changes for you. NBomber only enriches your logger with the session properties.
Bug fixes
- Fixed: the data transfer was lost for the failed scenario iterations, and it leaked into the next iteration. An iteration can end with an error, a timeout, or a restart. NBomber now attributes the measured bytes to that iteration.
- Pinned
Serilog.Sinks.SpectreConsoleto0.4.0. A transitive update of this package broke the console rendering.
What's next
- Follow our Roadmap to see what we plan for the next release.