NBomber v5.7.0 - Timescale, WebBrowser

· 4 min read
Olena Kostash
NBomber Core Team

In the new release, we focused on TimescaleDB support and web browser testing capabilities. Some of our customers use PostgreSQL to store various data, so adding PostgreSQL support through the Timescale extension was a logical step for us. Additionally, we are developing NBomber.Cloud and use Timescale to store and query our metrics.

TimescaleDB support

TimescaleDB is an open-source database designed to make SQL scalable for time-series data. It is engineered up from PostgreSQL and packaged as a PostgreSQL extension, providing automatic partitioning across time and space (partitioning key), as well as full SQL support. Using Reporting Sinks for TimescaleDB, you can store NBomber metrics into TimescaleDB and analyze your performance results with NBomber.MetricsUI (in development) or Grafana.

Example:

var timescaleDbSink = new TimescaleDbSink();

var scenario = Scenario.Create("scenario", async context => { ... });

NBomberRunner
.RegisterScenarios(scenario)
.WithReportingInterval(TimeSpan.FromSeconds(5))
.WithReportingSinks(timescaleDbSink)
.LoadInfraConfig("infra-config.json");

infra-config.json
{
"TimescaleDbSink": {
"ConnectionString": "Host=localhost;Port=5432;Database=metricsdb;Username=timescaledb;Password=timescaledb;Pooling=true;Maximum Pool Size=300;"
}
}

During the load test run, NBomber's metrics will appear in TimescaleDB, and you can query them.

For more information, please refer to our documentation.

WebBrowser testing

The primary use case for the browser testing is to test performance at the browser level. Browser-level testing allows you to measure user experience and identify issues that are challenging to detect at the protocol level. You can interact with the browser to script tests much closer to the actual website experience. You'll get insight into what your user sees on a browser level and catch issues skipped from the protocol level. At the same time, you can adopt a hybrid approach to performance testing by leveraging the existing functionalities of NBomber and performing backend load testing on a protocol level, all in the same scenario. This gives you a full picture of how the user experience is under different load scenarios.

NBomber.WebBrowser package adds a few useful extensions to the Playwright and Puppeteer libraries. Playwright is a library which provides a high-level API to control Chrome or Firefox. Playwright was created specifically to accommodate the needs of end-to-end testing. Playwright supports all modern rendering engines including Chromium, WebKit, and Firefox. Test on Windows, Linux, and macOS, locally or on CI, headless or headed with native mobile emulation.

// downloading the Chrome
var installedBrowser = await new BrowserFetcher(SupportedBrowser.Chrome).DownloadAsync(BrowserTag.Stable);
var browserPath = installedBrowser.GetExecutablePath();

using var playwright = await Playwright.CreateAsync();

await using var browser = await playwright.Chromium.LaunchAsync(
new BrowserTypeLaunchOptions
{
Headless = true,
ExecutablePath = browserPath
}
);

var scenario = Scenario.Create("playwright_scenario", async context =>
{
var page = await browser.NewPageAsync();

await Step.Run("open nbomber", context, async () =>
{
var pageResponse = await page.GotoAsync("https://nbomber.com/");

var html = await page.ContentAsync();
var totalSize = await page.GetDataTransferSize();

return Response.Ok(sizeBytes: totalSize);
});

await Step.Run("open bing", context, async () =>
{
var pageResponse = await page.GotoAsync("https://www.bing.com/maps");

await page.WaitForSelectorAsync(".searchbox input");
await page.FocusAsync(".searchbox input");
await page.Keyboard.TypeAsync("CN Tower, Toronto, Ontario, Canada");

await page.Keyboard.PressAsync("Enter");
await page.WaitForLoadStateAsync(LoadState.Load);

var totalSize = await page.GetDataTransferSize();
return Response.Ok(sizeBytes: totalSize);
});

await page.CloseAsync();

return Response.Ok();
})
.WithWarmUpDuration(TimeSpan.FromSeconds(3))
.WithLoadSimulations(
Simulation.KeepConstant(1, TimeSpan.FromSeconds(30))
);

For more information, please refer to our documentation.

NBomber improvements

In this release, we added a list of imrovements.

SessionId override

For specific scenarios, it can be helpful to control the session-id fully. Now you can pass your custom session-id via F#/C# API or CLI args.

NBomberRunner.RegisterScenarios(...)
.WithSessionId("my-session-123")
.Run()

CLI args:

--session-id=my-session-123

Manipulate data for reports

Another feature that we added is the ability to manipulate data for reports. There could be cases when you need to filter out some of the metrics data from your report. One example can be a "pause step" or "hidden step" that you can create and use but don't want to see in final reports. For this, you can use a new method:

Example:

NBomberRunner
.RegisterScenarios(scenario)
.WithReportFinalizer(data =>
{
var stepsStats = data.GetScenarioStats("mongo-read-write")
.StepStats
.Where(x => x.StepName != "pause")
.ToArray();

data.GetScenarioStats("mongo-read-write").StepStats = stepsStats;

return data;
})
.Run();

Cluster info for HTML report

Also, we extended our HTML report by adding NBomberConfig and Cluster Info with a list of agents who participated in the cluster.

What is next

Please follow our Roadmap page for the upcoming release.

NBomber v4.1.2

· One min read

NBomber 2.0

· 12 min read

Hey folks, we were busy for nearly half a year working on a new big release of NBomber. I am so happy to announce that we finally completed it!

In this release, we focused on improving engine performance, fixing RAM consumption issues, improving UI/UX, including reporting, extending API to provide flexibility but keep it SIMPLE as before.

Console

In the previous version, we always had a desire to improve the console output. The main pain point for us was the progress bar, which did not scale well while resizing the console, and sometimes it literally broke down when you are writing log messages to the console. The second most important problem for us was the table rendering, which was also displayed crookedly while resizing windows, and we wanted to fix this. We started considering Spectre.Console project for a long time as a good candidate for replacement and then we started a smooth transition. It was good with tables, but we still had some problems with the progress bar. Since for logs, we use Serilog, we figure out that we need to develop a proper integration between Serilog and Spectre.Console to fix our issue. After all, we developed Serilog.Sinks.SpectreConsole that nicely integrates Serilog with Spectre.Console. It's open-source, and you can use it for your integrations too. Now our console UI is much more stable, and I hope more beautiful :)

HTML report

We use Vue.js, which amazed us with its simplicity and minimalism for rendering HTML. Compared to the previous version, we have significantly expanded the functionality by adding: fail stats, status codes, hints analyzer results. You can take a look at the new HTML report here Also, we switched to Google Charts for rendering charts since it's free and under Apache 2.0 license.

Runtime Improvements

In this section, we will discuss some internals of NBomber that improve the performance and stability of the system.

Stats collecting

We refactored our stats collecting module to use the actor model via F# MailboxProcessor and to have one StatsScenarioActor per scenario. Also, we send metrics by batches to eliminate the overload of one actor by many concurrent ScenarioActors that execute steps and send metrics.

Minimizing RAM usage

Compression of stats results

We refactored our statistics module to fix the issue with memory growing footprint for long-running tests. Now you can run tests that will work for years and have a stable (usually small) memory footprint. This is achieved essentially due to one important optimization: all results are located in memory but decomposed into buckets with the same or very similar results. Each such bucket has its own counter, which is monotonically growing. Due to this optimization, we got quite effective compression. Aside from this, such optimizations are often used in time-series databases where many metrics of the same value or very similar can arrive at one point in time.

Default step timeout

Another important thing was introducing default timeout for steps. NBomber v1 did not support any timeouts out of the box, and this task shifted to the shoulders of the developers. For example, the HTTP plugin added its own timeout, which was quite sane. But on the other hand, everyone needs such a basic thing as a timeout, and forcing everyone to implement it is not a good idea. Also, newbies often weren't aware of this, and afterward, it led to the thread pool starvation problem. It especially was visible when testing very slow API using a big request rate, say 2-4K requests per sec from 1 node. It leads to many tasks (.NET Task) was activated, consumed RAM, and never finished but growing. In the new version, each step by default contains a timeout of 1 second and can be changed by the user.

Removed uneccesary memory allocations

We refactored a few places where we did extra memory allocations on every step invocation. For example, StepContext was previously created on every invocation.

Task computation expression

Internally, we use FsToolkit.ErrorHandling library that provides handy F# computation expressions and corresponding extensions. With the latest updates to this library for work with Task, we have automatically switched to using Ply library, which provides a low overhead Task computation expression.

Low-level optimizations

GC tuning

Also, we tuned GC a bit. At runtime, we set:

GCSettings.LatencyMode <- GCLatencyMode.SustainedLowLatency

And also, for the project settings, we apply:

<ServerGarbageCollection>true</ServerGarbageCollection>
<ConcurrentGarbageCollection>true</ConcurrentGarbageCollection>

New Statistics

One of the major changes we had been working on is the statistics module. Initially, we didn't really want to change it, but using NBomber v1 in production, we often ran into bottlenecks or questions regarding providing advanced statistics.

Ok and Fail stats

An important addition to the previous statistics was that we started tracking the fail stats with the full scope, including data transfer for fails, latency, and percentiles.

type OkStepStats = {
Request: RequestStats
Latency: LatencyStats
DataTransfer: DataTransferStats
StatusCodes: StatusCodeStats[]
}

type FailStepStats = {
Request: RequestStats
Latency: LatencyStats
DataTransfer: DataTransferStats
StatusCodes: StatusCodeStats[]
}

type StepStats = {
StepName: string
Ok: OkStepStats
Fail: FailStepStats
}

Now you can write your assertions for fails stats too. Also, you will see them in reporting, including real-time reporting too.

// here is an example of assertion
let step1 = scenarioStats.StepStats.[0]

// ok stats
test <@ step1.Ok.Request.Count >= 4 @>
test <@ step1.Ok.Latency.MinMs <= 503.0 @>
test <@ step1.Ok.Latency.Percent50 <= 505.0 @>
test <@ step1.Ok.DataTransfer.MinBytes = 100 @>

// fail stats
test <@ step1.Fail.Request.Count = 0 @>
test <@ step1.Fail.Latency.MinMs = 0.0 @>
test <@ step1.Fail.DataTransfer.MinBytes = 0 @>

Unit of measure

In the new version, we changed basic data types to represent latency and data transfer.

Latency

We started using float instead of integer to expand the range of possible results for latency, for example: [0.2 ms, 1.5 ms, 9.3 ms]. We were pushed to this by the case of testing a high-speed in-memory database that had a latency of less than 1 ms, and in our reports, we saw it as 0 ms instead of 0.1 - 0.5 ms. Just for the record, most load test tools represent latency as integer, meaning using them, you cannot cover such cases since your results will be 0 ms.

type LatencyStats = {
MinMs: float
MeanMs: float
MaxMs: float
Percent50: float
Percent75: float
Percent95: float
Percent99: float
StdDev: float
LatencyCount: LatencyCount
}

Data transfer

We switched to using Byte instead of KB to keep parity with standard tools for data transfer stats.

type DataTransferStats = {
MinBytes: int
MeanBytes: int
MaxBytes: int
Percent50: int
Percent75: int
Percent95: int
Percent99: int
StdDev: float
AllBytes: int64
}

In addition, we provide helper functions for converting Byte to KB and MB. This can be useful when you want to assert on KB or MB.

test <@ kb (step1.Ok.DataTransfer.MinBytes) <= 50.0 @>
test <@ mb (step1.Ok.DataTransfer.MinBytes) <= 50.0 @>

Hint Analyzer

In this release, we have integrated a new HintAnalyzer feature that allows to analise the results of statistics and, based on this, displays hints. HintAnalyzer may refer not only to the statistics data but also to the use of certain plugins. Any NBomber plugin can add new analyzers. For example, PingPlugin pings the target host before starting any test, and after that, it analyzes received results and prints hints.

plugin stats: NBomber.Plugins.Network.PingPlugin

HostStatusAddressRound Trip TimeTime to LiveDon't FragmentBuffer Size
nbomber.comSuccess104.248.140.12858 ms128False32 bytes

Here's a hint by PingPlugin.

sourcenamehint
WorkerPluginNBomber.Plugins.Network.PingPluginPhysical latency to host: 'nbomber.com' is bigger than 2ms which is not appropriate for load testing. You should run your test in an environment with very small latency.

Also, HintAnalyzer can suggest some other hints related to the usage of NBomber.

sourcenamehint
Scenariosimple_httpStep 'fetch_html_page' in scenario 'simple_http' didn't track data transfer. In order to track data transfer, you should use Response.Ok(sizeInBytes: value)

You can disable HintAnalyzer if you want

Scenario.create "simple_http" [step]
|> NBomberRunner.registerScenario
|> NBomberRunner.disableHintsAnalyzer

New API

In the new version, we have added a couple of additions that improve the convenience of writing test scripts without adding new abstractions to NBomber itself. We are very scrupulous about adding any new features to NBomber as they can introduce additional abstractions and hence additional complexity. Our initial goal was to build an easy-to-use framework with as few abstractions as possible. Therefore, any new feature that we consider should be easy to understand and harmoniously fit into NBomber.

Status code

We have added the ability to specify any status codes you want or your protocol, or your API service returns.

Response.ok(statusCode = 100)

Also, we provide statistics on status codes.

type StatusCodeStats = {
StatusCode: int
Message: string
Count: int
}

Step invocation count

For certain tests, it may be necessary to understand the current step invocation count. For example, you want to change the behavior of your step execution when the step's invocation counter is reached 100 invocations. For such cases, you need to start a counter and manually increment it. NBomber now supports this out of the box.

let step = Step.create("step", fun context -> task {    

// invocation count of the current step
// (will be incremented on each invocation)
context.InvocationCount // int

return Response.ok()
})

Step timeout

In the new version, each step by default contains a timeout of 1 second and can be changed by the user.

let step = Step.create("step", 
timeout = seconds 0.5,
execute = fun context -> task {

return Response.ok()
})

Dynamic step order

We decided to provide the ability to change the order of the steps at runtime dynamically. Also, it allows changing the number of steps per scenario iteration. This feature opens up a new horizon of possibilities for writing load tests. We came up with this idea from a real case when we tested the database, and we needed to introduce a certain randomity into our tests. For a better understanding, I suggest looking at an example:

// by default these steps will run sequentially
Scenario.create "test_redis" [step1; step2]

// in this case, only step2 will be invoked
|> Scenario.withDyncamicStepOrder(fun () -> [| 1 |])

// in this case, we reversed the order of steps
|> Scenario.withDyncamicStepOrder(fun () -> [| 1; 0 |])

// in this case, we introduce randomity
|> Scenario.withDyncamicStepOrder(fun () ->
let index1 = random.Next(0, 1)
let index2 = random.Next(0, 1)
[| index1; index2 |]
)

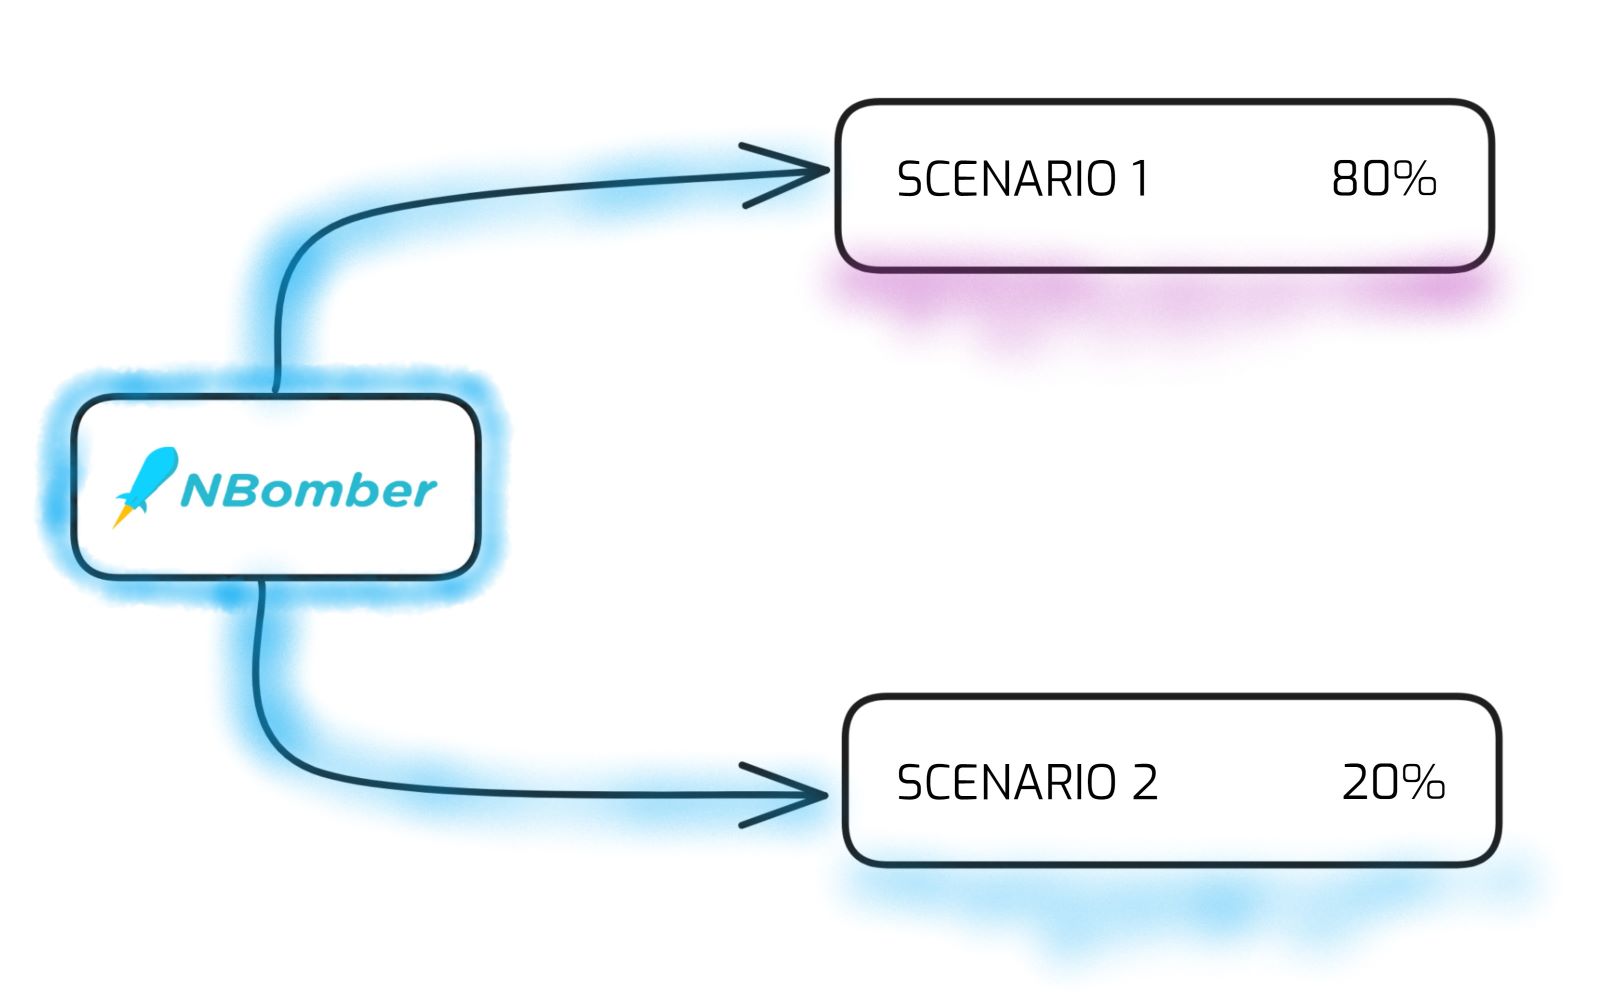
Basically, with this feature, you can introduce convenient load distribution. For example, you can define a scenario where you will test Redis database with the following request distribution: 30% for write requests and 70% for read requests.

Scenario.create "test_redis" [write_redis; read_redis]
|> Scenario.withDyncamicStepOrder(fun () ->
// using a randomator you can specify:
// - 30% will be write_redis
// - 70% will be read_redis
)

Scenario info

It's a context property that contains info about the current Scenario. The main use case is to use ScenarioInfo.ThreadId as correlation id for your requests. Another one is to use ScenarioInfo.ThreadNumber for partition your requests. For example, you have a database, and you want to split all your requests into 4 partitions.

let step = Step.create("step", fun context -> task {    
// gets the current scenario thread id
// you can use it as correlation id
context.ScenarioInfo.ThreadId
context.ScenarioInfo.ThreadNumber
context.ScenarioInfo.ScenarioName
context.ScenarioInfo.ScenarioDuration

return Response.ok()
)

TimeSpan extensions

We added TimeSpan extensions for F# and C# to have a more expressive API.

milliseconds 500
seconds 2
minutes 1

Init-only scenarios

NBomber had the ability to provide Scenario initialization via Scenario.init in the very first version. It had a mandatory restriction to create a Scenario you should provide at least one Step.

// you should provide at least one step
Scenario.create "write_scenario" [write_step]
|> Scenario.init populateKafka

This was convenient until the moment when several scenarios had a dependency on the same initialization. In this case, only one initializer should be executed, and it's getting tricky since NBomber v1 didn't provide any functionality for this.

// both scenarios depend on populateKafka
Scenario.create "write_scenario" [write_step]
|> Scenario.init populateKafka

Scenario.create "read_scenario" [read_step]
|> Scenario.init populateKafka

In NBomber v2, we can define Scenario without steps and have only the init or clean function.

let initScenario = 
Scenario.create "init_scenario" [] // no steps
|> Scenario.init populateKafka
|> Scenario.clean cleanKafka

let writeScenario = Scenario.create "write_scenario" [write_step]
let readScenario = Scenario.create "read_scenario" [read_step]

// now all scenarios will be executed
NBomberRunner.registerScenarios [initScenario; writeScenario; readScenario]
|> NBomberRunner.run

// now you can simply chnage scenarios
NBomberRunner.registerScenarios [initScenario; writeScenario]
|> NBomberRunner.run

// or
NBomberRunner.registerScenarios [initScenario; readScenario]
|> NBomberRunner.run

LoadSimulation inject random

Injects a random number of scenario copies (threads) per 1 sec during a given duration. Use it when you want to maintain a random rate of requests without being affected by the target system's performance under test.

Scenario.create "scenario_2" [read_step]
|> Scenario.withLoadSimulation [
InjectPerSecRandom(minRate = 10, maxRate = 50, during = seconds 10)
]

Logs

In the new version, we write a log file to the current session folder.

/{current_session_id}/nbomber-log-{date}.txt
/{current_session_id}/reports

HTTP plugin

NBomber.Http has been slightly modified to make it easier to be used. In the previous version, this plugin provided an HttpStep wrapper over the standard Step that hid many details and added extra magic. In the new version, we have reworked the approach with DSL plugins to use standard NBomber abstractions instead of creating new ones. Now, the HTTP plugin contains HttpClientFactory and has an HTTP module with functions for building HTTP requests.

let httpFactory = HttpClientFactory.create()

let step = Step.create("simple step",
clientFactory = httpFactory,
execute = fun context ->

Http.createRequest "GET" "https://nbomber.com"
|> Http.withHeader "Accept" "text/html"
|> Http.withBody(new StringContent("{ some JSON }"))
|> Http.withCheck(fun response -> task {
return if response.IsSuccessStatusCode then Response.ok()
else Response.fail()
})
|> Http.send context
)

InfluxDb plugin

InfluxDb plugin is supplemented with tracking fail stats and load simulation value. In Grafana, you can render your load simulation timeline and compare it with what your target system can handle.